| INTRODUCTION
Measuring the absolute and relative risk among peers is essential to making risk in banks transparent for stakeholders. Further, a bank’s performance against articulated goals, such as those provided in a Risk Appetite Statement (RAS), is not always aligned with public perception. This article explains how an AI-driven Scaled Risk Score (ScRS) derived from publicly sourced data can add valuable insight for stakeholders interested in a company’s risk-adjusted performance.
Risk scoring enables comparisons among banks. In particular, our methodology, derived from empirical studies, has a minimum ScRS of 1 and a maximum of 100. Further, we integrated academic research with empirical studies and showed that a high ScRS differentiates banks that successfully manage risk from banks with a low ScRS. Our risk score is a function of key risk factors such as liquidity risk, stress scenario interest rate risk, concentration risk, and Net Interest Income (NII) risk.
| RISK MANAGEMENT FRAMEWORK
A Risk Appetite Statement (RAS) is a key component of a Risk Management Framework (RMF). The RMF describes a bank’s risk policies, methodologies, and risk infrastructure, which are necessary to build a robust risk management program.
A well-defined RAS considers a bank’s vision, values, strategy, risk tolerance, and risk capacity. It also includes a narrative about the bank’s risk appetite and financial performance goals. A scaled risk score identifies material risk focus areas in an easily understood quantitative form that helps bank management and the board set a bank’s risk appetite.
| OUTLIERS
A well-constructed risk score helps identify banks that are outliers against peers based on risk factors such as funding liquidity, balance sheet composition, and growth. For example, we provide illustrative examples of our risk scores from a variety of perspectives, such as a liquidity risk score (see point 1), a stress scenario interest rate risk score (see point 2), a concentration risk score (see point 3) and an NII risk score (see point 4).
Our risk score (among other risk factors) incorporates key balance sheet ratios. For example, from a liability perspective, our risk score incorporates the ratio of uninsured deposits as a percentage of total deposits. As another example, from an asset perspective, our risk score incorporates the ratio of the value of long-dated Available-for-sale (AFS) plus Hold-to-Maturity (HTM) securities as a percentage of total capital.
1 Liquidity risk factor for Bank A compared to SVB
For example, at year-end 2022, our risk-scoring approach for Bank A, with assets in the $50 to 80 billion range, revealed a liability and asset liquidity score of 98 and 29, respectively. In contrast, our risk-scoring approach for Silicon Valley Bank (SVB) resulted in a liability and asset liquidity score of 6 and 29, respectively. The higher liability liquidity risk of SVB, compared to bank A, can partly be attributed to the very large percentage of its uninsured deposits (94%).
"A well-defined RAS considers a bank’s vision, values, strategy, risk tolerance, and risk capacity. It also includes a narrative about the bank’s risk appetite and financial performance goals"

2 Stress scenario interest rate risk factor for Bank B compared to First Republic Bank
Our risk scoring approach for Bank B, with over $1 billion in net income, revealed a stress scenario interest rate risk score of 66 that was substantially better than First Republic Bank’s stress scenario interest rate score of 16.
3 Concentration risk factor for Bank C compared to First Republic Bank
Our concentration risk score for Signature Bank revealed an asset concentration risk score of 68, a liability concentration risk score of 7, and an overall concentration risk score of 38. In contrast, our risk scoring approach for Bank C, with assets between $50 to 80 billion, revealed an asset concentration risk score of 91, a liability concentration risk score of 79, and a much better overall concentration risk score of 85.
4 NII risk factor for Bank B compared to Signature Bank
Signature Bank’s short-term NII exposure over one year is evidenced by our interest rate risk score of 89 for a change in interest rates of +100 bps. Our risk-scoring approach for Bank B revealed that its short-term NII exposure over the same one-year period had a much worse interest rate risk score of 25 for a change in interest rates of -100 bps.


5 Integrated risk factor perspective for Bank A compared to SVB
Our risk-scoring approach for Bank A revealed a liability and asset liquidity score of 98 and 29, a stress scenario Interest rate risk score of 72, an overall concentration risk score of 61, and an NII risk score of 58.
In contrast, our risk-scoring approach for SVB resulted in a liability and asset liquidity score of 6 and 29, a stress scenario Interest rate risk score of 1, an overall concentration risk score of 16, and an NII risk score of 75.
In summary, based on these four score factors, the scaled risk scores indicate that Bank A had substantially less risk than SVB.

In addition, our risk-scoring methodology flags if a bank has excessive risk relative to their peers. For example, the asset concentration risk score for Bank A is 29, a red flag that Bank A has a large concentration of assets. As another example, SVB had a bottom decile score in their liquidity and concentration risk scores. Therefore, our scoring would have sent a red flag warning that SVB had a dramatically severe risk profile compared to its peers.
| CUSTOMIZED RISK SCORES
A scaled risk-scoring methodology can be customized to integrate internal and external data. For example, a risk score can incorporate external peer analysis with internal bank data.
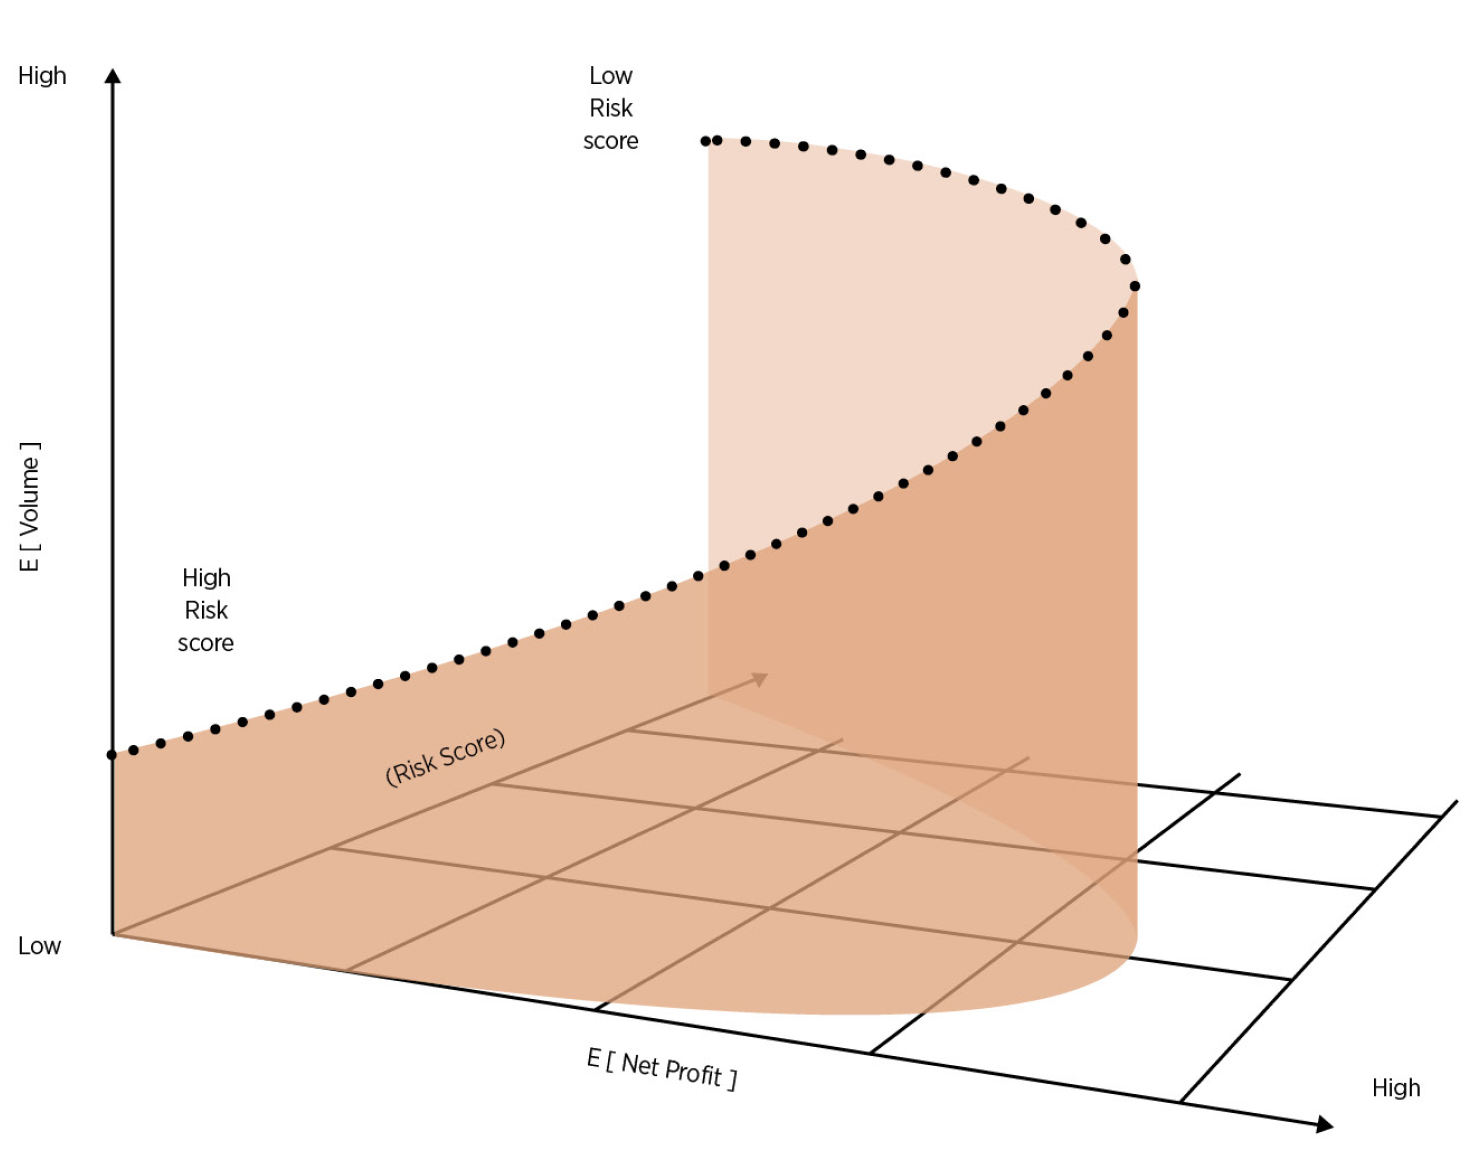
A key challenge for a bank is to set risk appetite and financial performance targets to achieve strategic goals that align financial performance, such as expected net profit with risk. Further, an integrated risk score can influence competitive strategies and internal bank data, such as optimally increasing market share, financial performance, and risk tradeoffs, as shown in the figure 01.
Another challenge is to decide how much a bank is willing to invest or expend to mitigate risk scores in alignment with its risk appetite.
"A key challenge for a bank is to set risk appetite and financial performance targets to achieve strategic goals that align financial performance, such as expected net profit with risk"


| CONCLUSION
We initially consulted with a few banks to build an early version of our scaled risk-scoring approach, which aligns financial performance with our risk scores and enables comparability among a peer pool of banks. It incorporates publicly available economic, accounting, and regulatory data that can be customized to provide valuable insights into internally managing risk and transparency for external stakeholders. Regulators can also use our methodology to help them with their examination priorities.
Our ScRS provides a comprehensive, user-friendly, scaled, and back-tested approach to compare banks among peers. Further, it provides specific warning signals to management that it may need to take action, given that the bank may be perceived as riskier than its peers. Such actions may include, for instance, explaining why the bank is focused on a specific asset class or alternatively changing the mix of assets and liabilities to reduce concentration risk.

Bob Mark
Founding Partner and Chief Executive Officer, Black Diamond Risk.
blackdiamondrisk.com

Enrico Dallavecchia
President and COO, Arctium Capital Management.
arctiumcapital.com


