

President Donald Trump’s second term, which began on January 20, 2025, has been defined by a series of bold policy shifts and initiatives aimed at ushering in what he describes as a “Golden Age” for the United States. In just nine months, the global landscape has undergone a rapid transformation. The key question now is whether his America First agenda will drive a sustained economic expansion and relative global stability marked by peace, or instead will lead to contraction, conflict, and the emergence of new adversaries, an unfolding tension between “Golden Age and Chaos.
Trade has been a fundamental aspect of human civilization, driving economic growth, cultural exchange, and technological advancement. From the ancient barter system to modern global trade agreements, the exchange of goods and services has shaped societies and economies. One of the most significant moments in US trade history was when the Smoot-Hawley Tarriff Act was signed into law in 1930 by President Herbert Hoover, aimed to protect American farmers and manufacturers by imposing high tariffs on imported goods. However, instead of reviving the US economy, it exacerbated the economic downturn during the Great Depression and restricted international trade.
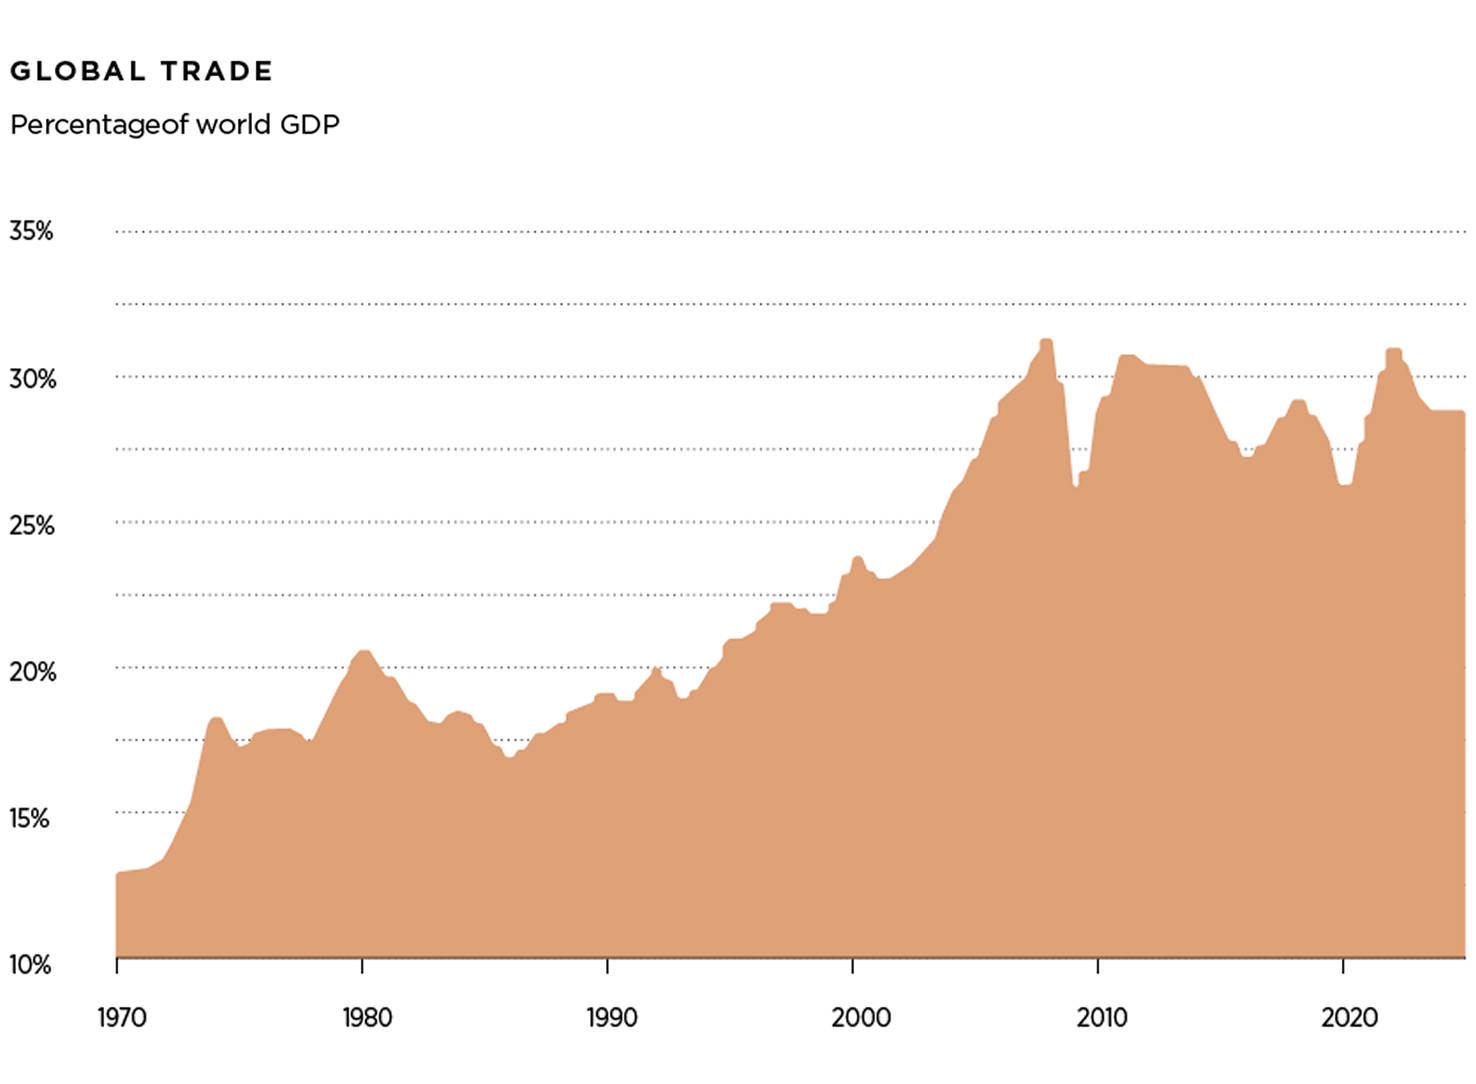
After the end of World War II, the US led the way to create the General Agreement on Tariffs and Trade (GATT) in 1947 and its successor the World Trade Organization (WTO) in 1995 to reduce tariffs, embrace trade liberalization, and foster international cooperation. As a result, global trade boomed in the 1990s and early 2000s as WTO helped facilitated multilateral trade agreements and dispute settlement mechanisms for unfair trade practices. President Clinton signed the US-China Relations Act of 2000, granting Beijing permanent normal trade relations with the US and paving the way for China to join the WTO in 2001. However, trade openness has been slowing following the Global Financial Crisis (2007-2009), the outbreak of COVID-19 (2020-2022), and now with Liberation Day (April 2, 2025) where President’s Trump tariff shock is pushing the US toward a full decoupling from China and a new unilateral world order.
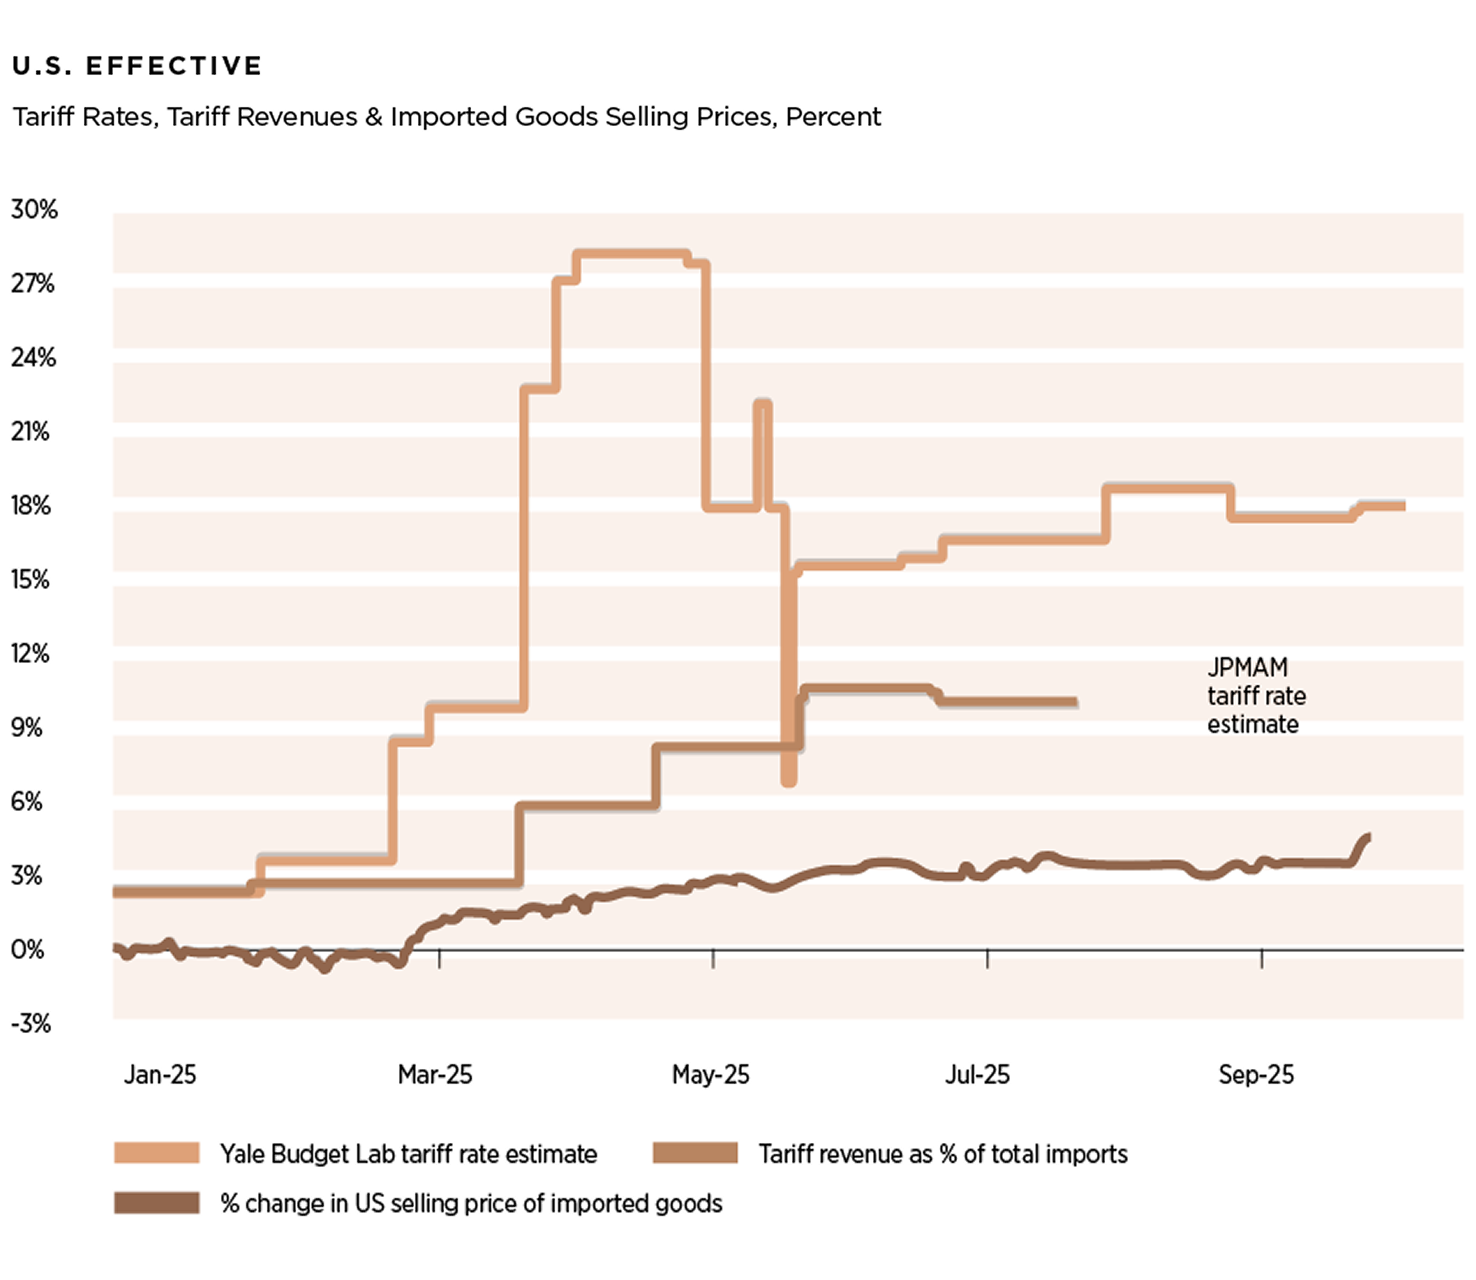
On April 2, 2025, a day President Donald Trump proclaimed as “Liberation Day” his administration announced the implementation of a 10% universal baseline tariff on all imports, along with significantly higher country-specific tariffs. However, the situation surrounding U.S. trade policy remains fluid and subject to rapid change. Just one week later, on April 9, 2025, President Trump carried out one of the most dramatic economic reversals in modern presidential history by scaling back many of the recently approved tariffs on imports from most U.S. trading partners. Despite this reversal, the overall level of trade protection remains elevated. According to recent estimates from Yale University and JPMorgan, the effective average U.S. tariff rate now stands at approximately 18% and 14%, respectively, substantially higher than historical norms.

On October 9, 2025 China, the world’s largest rare earths and rare earth magnets producer announced new critical materials export controls targeting the U.S. If these controls are aggressively enforced by China, the impacts would be felt in semiconductor, automotive, consumer electronics, aerospace, defense, robotics, medical imaging, medical equipment and telecommunications industries. The new curbs come ahead of a scheduled face-to-face meeting between Trump and Xi in South Korea at the end of October. As the U.S., the European Union and others race to build alternatives to the Chinese rare earth supply chain, the world is likely to enter a period of structural bifurcation.
U.S. policy uncertainty stemming from new trade tariffs, government shutdown, rising fiscal deficit, and the erosion of the dollar is weighing on investment, market sentiment, inflation, employment, corporate earnings, valuations, growth expectations, and geopolitical stability. We are at a critical fork in the road, after a decade of US-led dominance, the case for diversification is back. Valuation spreads between the US and the rest of the world are at historical highs, and market concentration has intensified. Given the high level of uncertainty about the path forward, volatility is likely to persist as capital allocators reassess historically large exposures to U.S. assets.
Unwinding the postwar global trading system that the U.S. helped build over the past 80 years carries significant costs and consequences that extend beyond economics. If tariffs continue to pressure U.S. firms’ profit margins and reduce real income for U.S consumers, it could undermine the narrative of U.S. preeminence. The most effective way for the Trump administration to ensure that U.S. preeminence endures over the long term is to demonstrate tangible progress on trade deals and implement a more balanced trade policy. At the same time, it remains essential for the U.S. to preserve its democratic institutions, rule of law, education system, checks and balances, military strength, and global economic and military alliances.
For end of 2026, the S&P 500 base case is 7,500 and bull case 7,800 points. The economic effects of tariffs are likely to generate a temporary rise in inflation and as a result divert the FED’s 2% target. Navigating this path requires a cautious investment approach as macroeconomic imbalances, protectionism and two ongoing wars are building up tail risks. If tariffs become broad and permanent, the range of outcomes would be wide as they can have widespread economic, geopolitical and social consequences.
The Federal Reserve cut short-term interest rates by 50 basis points at its September 2024 FOMC meeting, followed by two additional reductions of 25 basis points each in November and December 2024. The move comes in response to encouraging inflation data and growing concerns about potential labor market softening. The rationale for the bold cut was the shift in focus from inflation risks to employment risks, and the FED determination not to fall behind the curve in the easing cycle. In line with market expectations, the FED cut interest rates by 25 basis points at the September 2025 meeting, bringing the funds rate to 4.0-4.25%. This was the first rate cut in nine months, and came on the back of a softer-than-expected August jobs report. The annual Consumer Price Index (CPI) in the US reached 7.0% at the end of 2021, 6.4% at the end of 2022, 3.3% at the end of 2023, 2.9% at the end of 2024, according to the US Bureau of Labor Statistics. The annual CPI is expected to reach 2.8% in 2025 and 2.5% in 2026 according to Goldman Sachs.
The FED Dot Plot indicates that the median of the FOMC voting members is expected to cut 50 bps in 2025 and 75 bps in 2026, forecasting the terminal federal funds target rate to 2.75% in 2028. The expected FED rate for the end of 2025 will be between 3.5% and 3.75% and 2.75% and 3.0% at the end of 2026. However, as the situation is very fluid a sharp rise in long-term expectations would signal a loss of faith in the FED’s ability to bring inflation back to the 2% target.
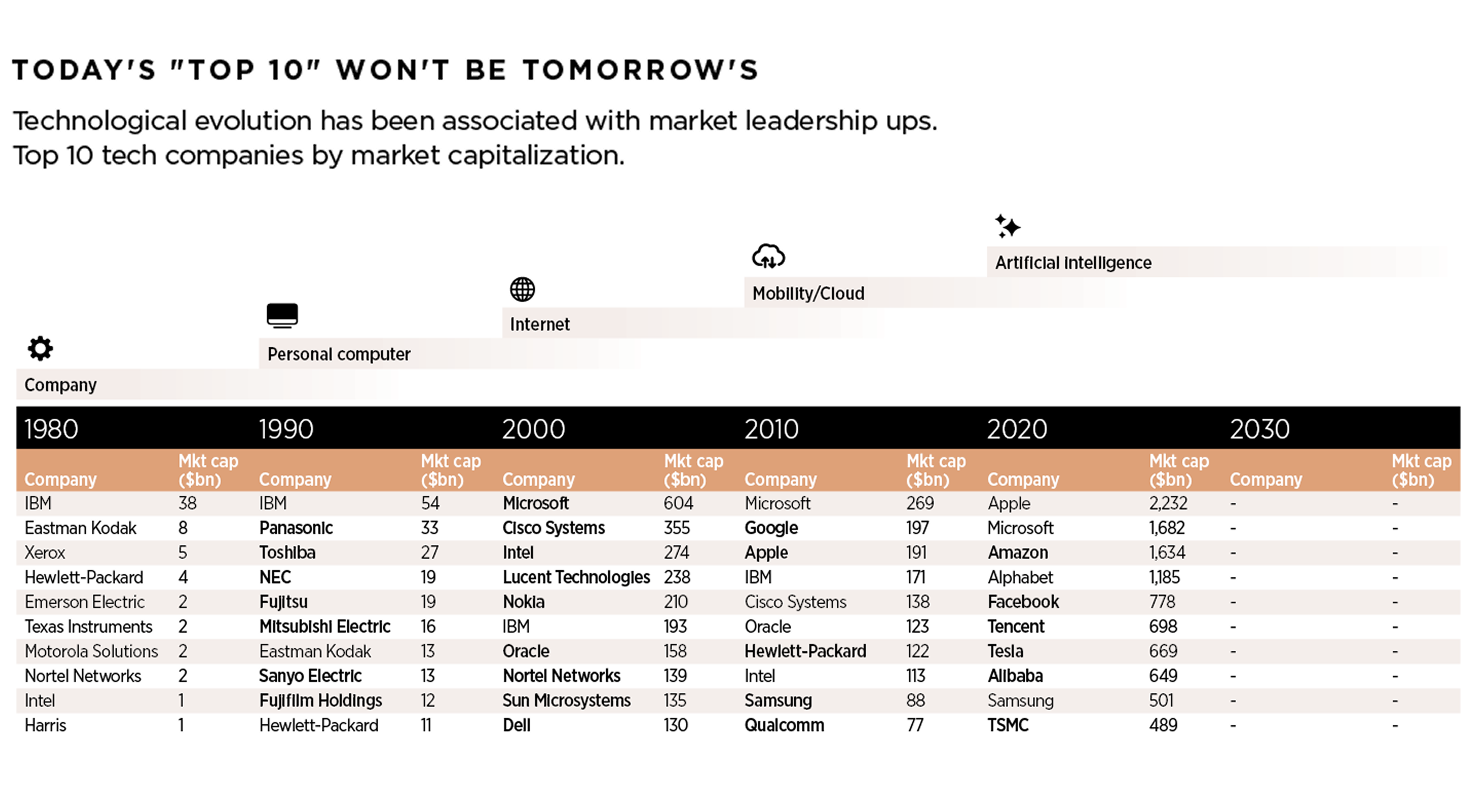
On October 12, 2022 the S&P index reached a low of 3,577 trading at a P/E of 15x. The 10-year US Treasury Note hit a 16-year high of 4.99% in October 19, 2023. The three major US indexes S&P 500, NASDAQ & RUSSELL confirmed a bear market on June 13, 2022 and the DOW confirmed a bear market until September 30, 2022, often a bear market precedes a recession. After US’s main indexes entered into bear market territory in 2022, most US stocks, in particular the so-called “Magnificent 7” have rallied in 2023 and 2024 as signs of easing inflation, a more accommodative monetary policy stand, earnings growth and technological transformation. Strong performance by MSFT, NVDA, AAPL, GOOG, AMZN and META has contributed around 44% of the index return. These companies are positioned to benefit from global MegaTrends and are at the core of the artificial intelligence revolution. However, it is difficult to predict which companies will be the top performers tomorrow, as market conditions are consistently changing. Some top-of-mind investor concerns are: U.S. power constrains and the profitability of AI investments relative to the capital deployed.
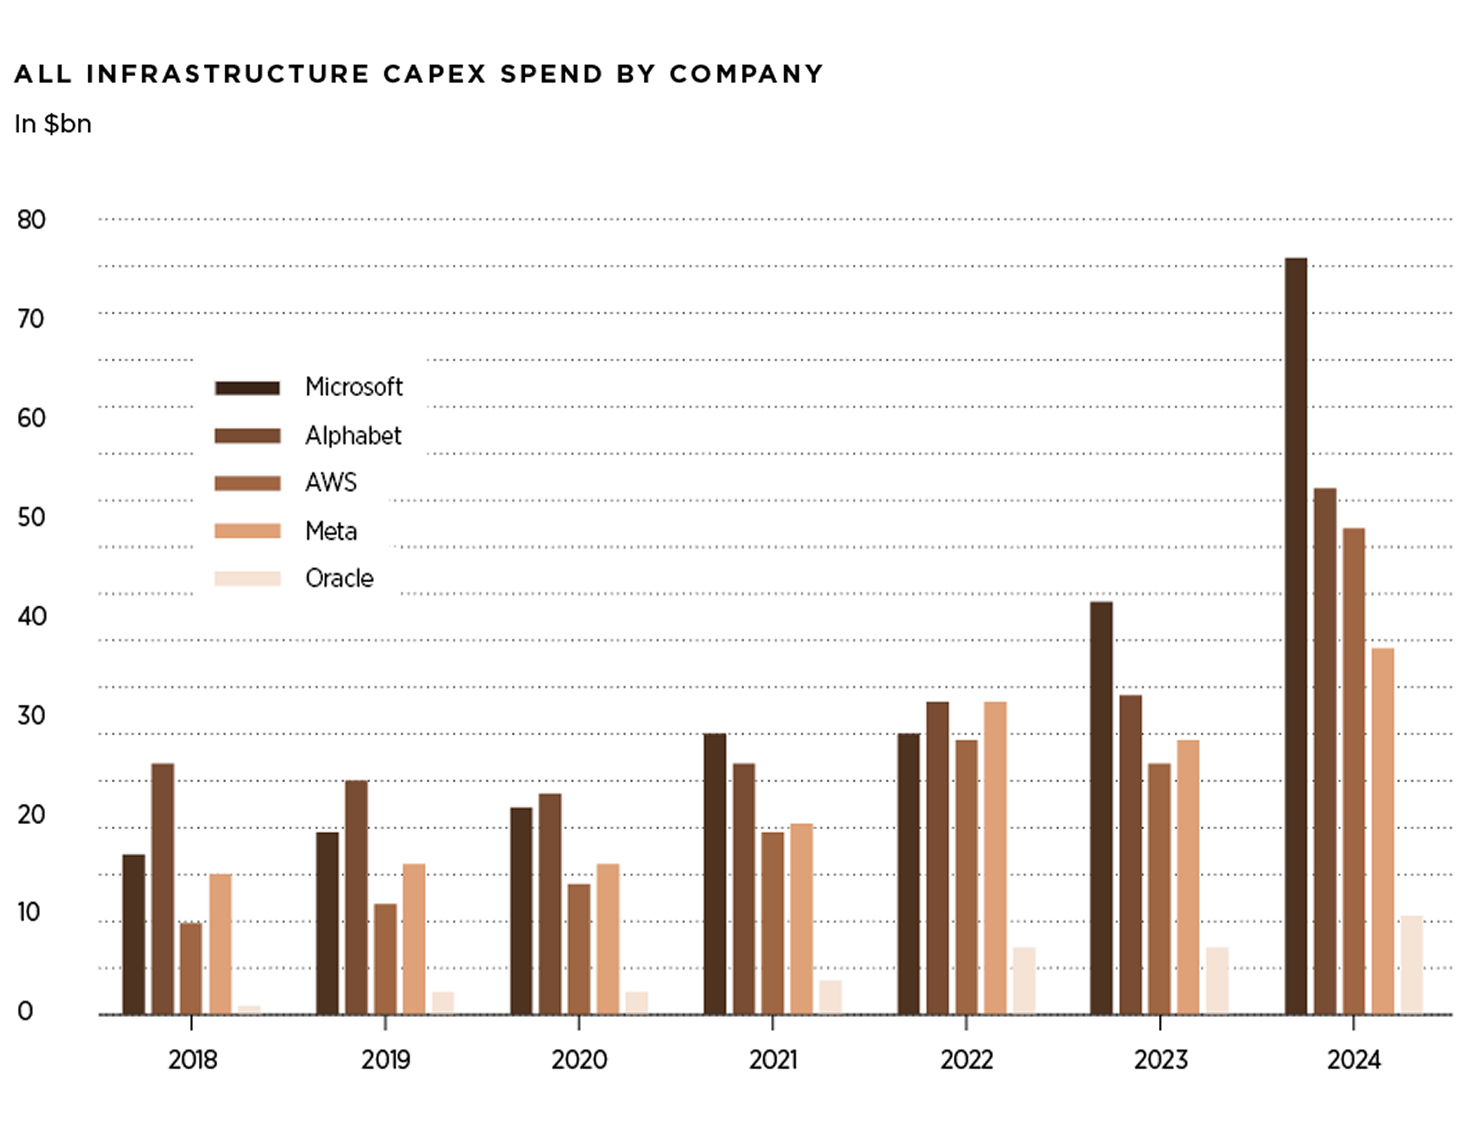
The macro backdrop of healthy earnings growth, loose financial conditions, and falling policy uncertainty should support strong cash spending next year. Goldman Sachs forecasts that S&P 500 companies will spend $4.4 trillion in 2026. The large AI hyperscalers have increased their capex investments from $153 billion in 2023 to an estimated $390 billion in 2025. Organic earnings growth, cash flows and cash spending will likely benefit from provisions in the OBBB Act that made R&D, equipment capex and some structure capex fully deductible expenses.
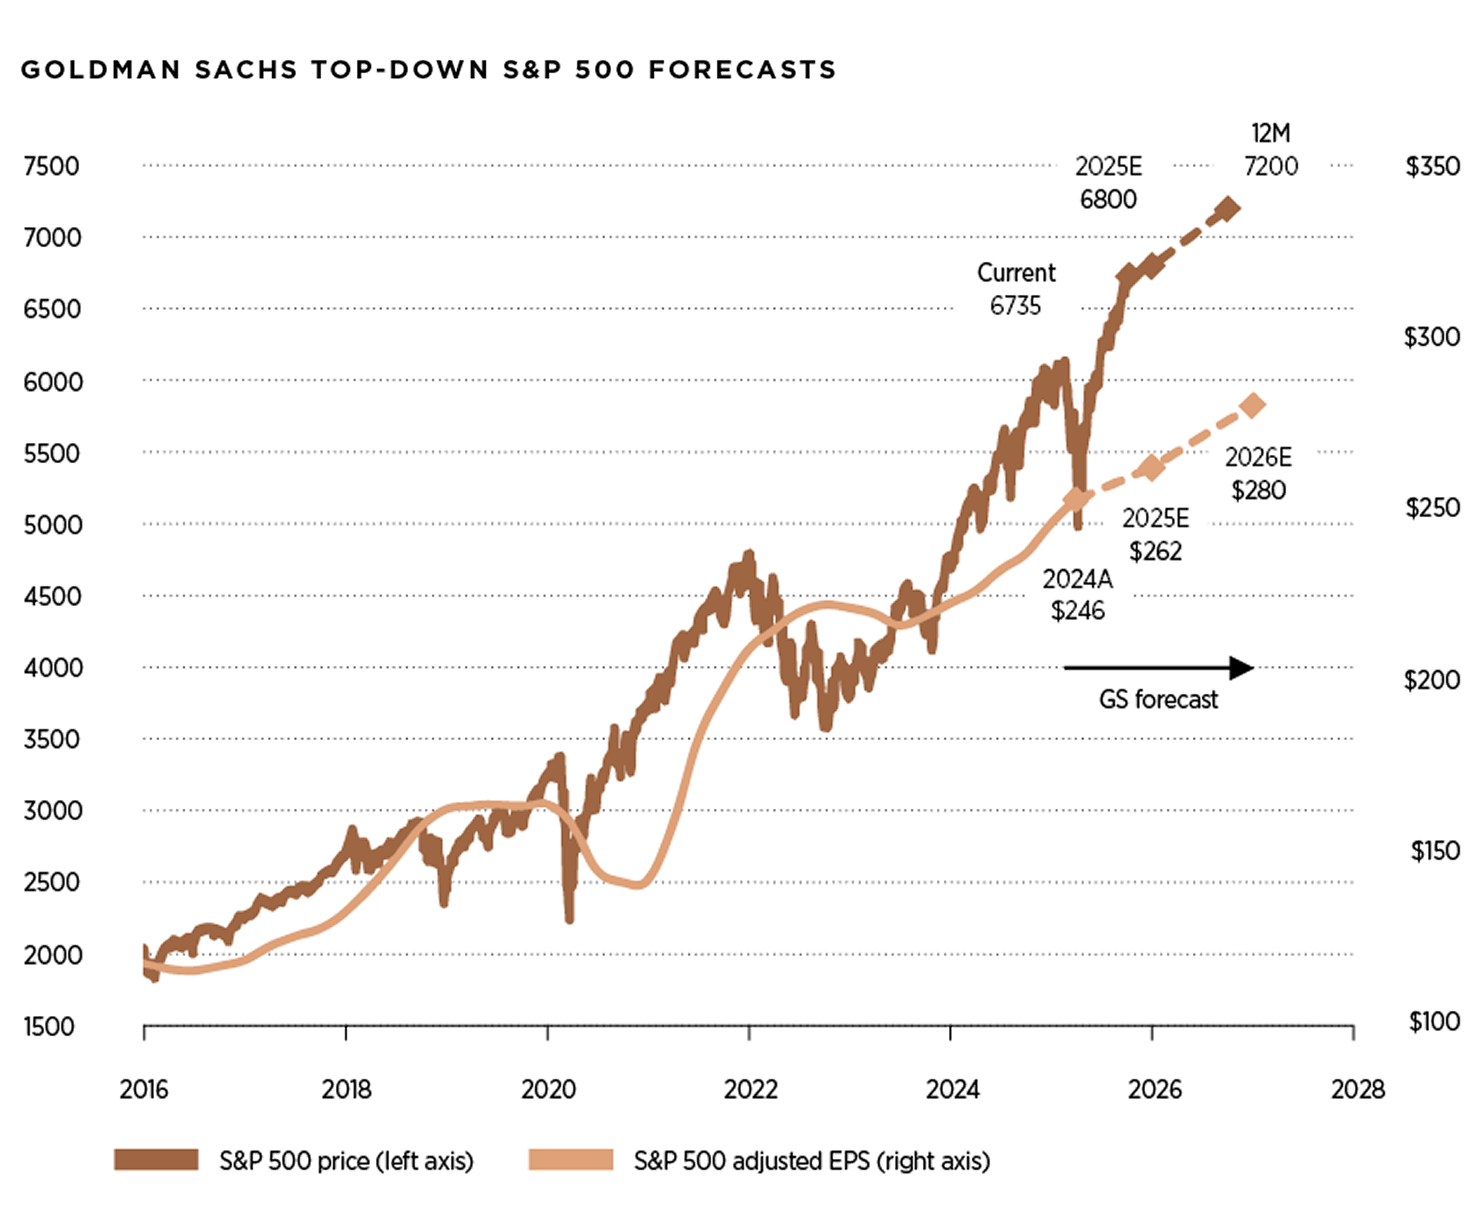
On October 24, 2025, the S&P 500 closed at an all-time high of 6,791 points, posting a year-to-date gain of 15.6%. The index is currently trading at a forward 2026 P/E ratio of 22x. Year to date, the NASDAQ & Russell 2000 have advanced 20.1% and 12.7%, respectively, while the 10-year US Treasury yielded stands at 3.99%.
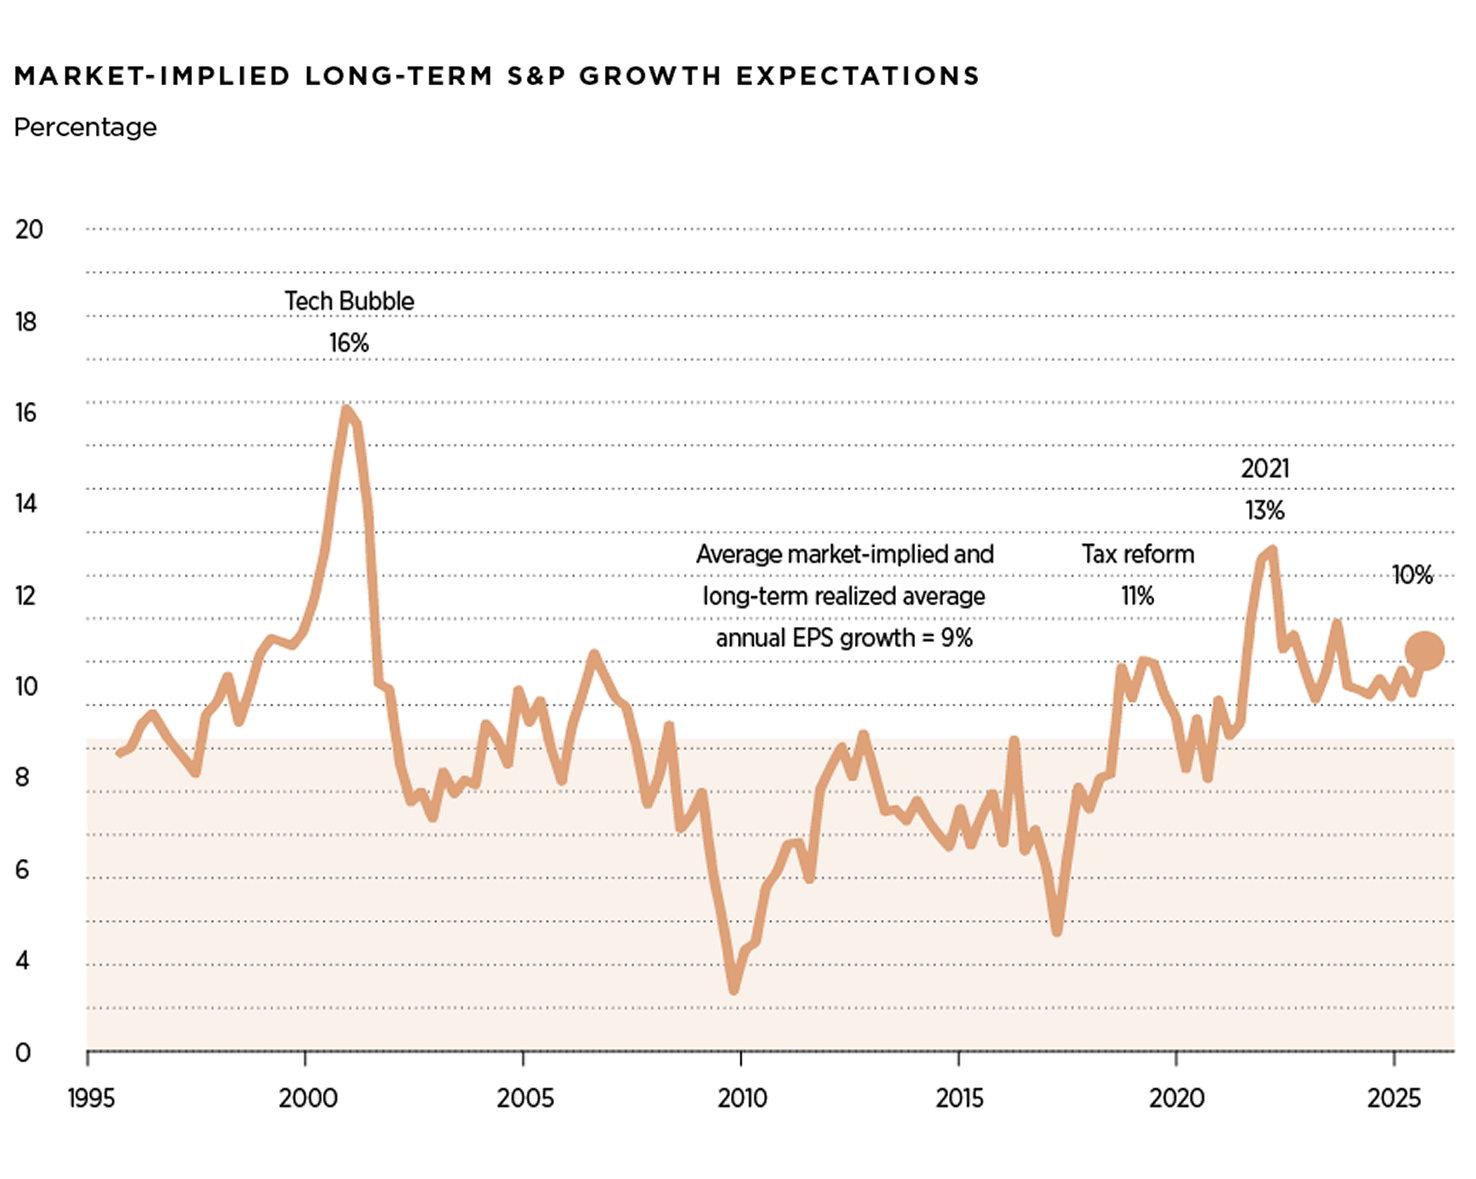
In general, long-term equity returns are driven by the earnings growth of the asset and the change in valuation. In 2023, the S&P 500 EPS closed at USD $223 and USD $246 in 2024, and according to Goldman Sachs EPS is expected grow 7% to USD $262 in 2025 and 7% to USD $280 in 2026. While U.S. equity prices have continued to reach record highs, S&P 500 long-term growth expectations remain near historical averages. Goldman Sachs estimate that market-implied long-term earnings growth stands at 10% today, only slightly higher than the long-term average of 9% and well below levels reached at the height of the Tech Bubble in 2000 (16%) and in 2021 (13%).
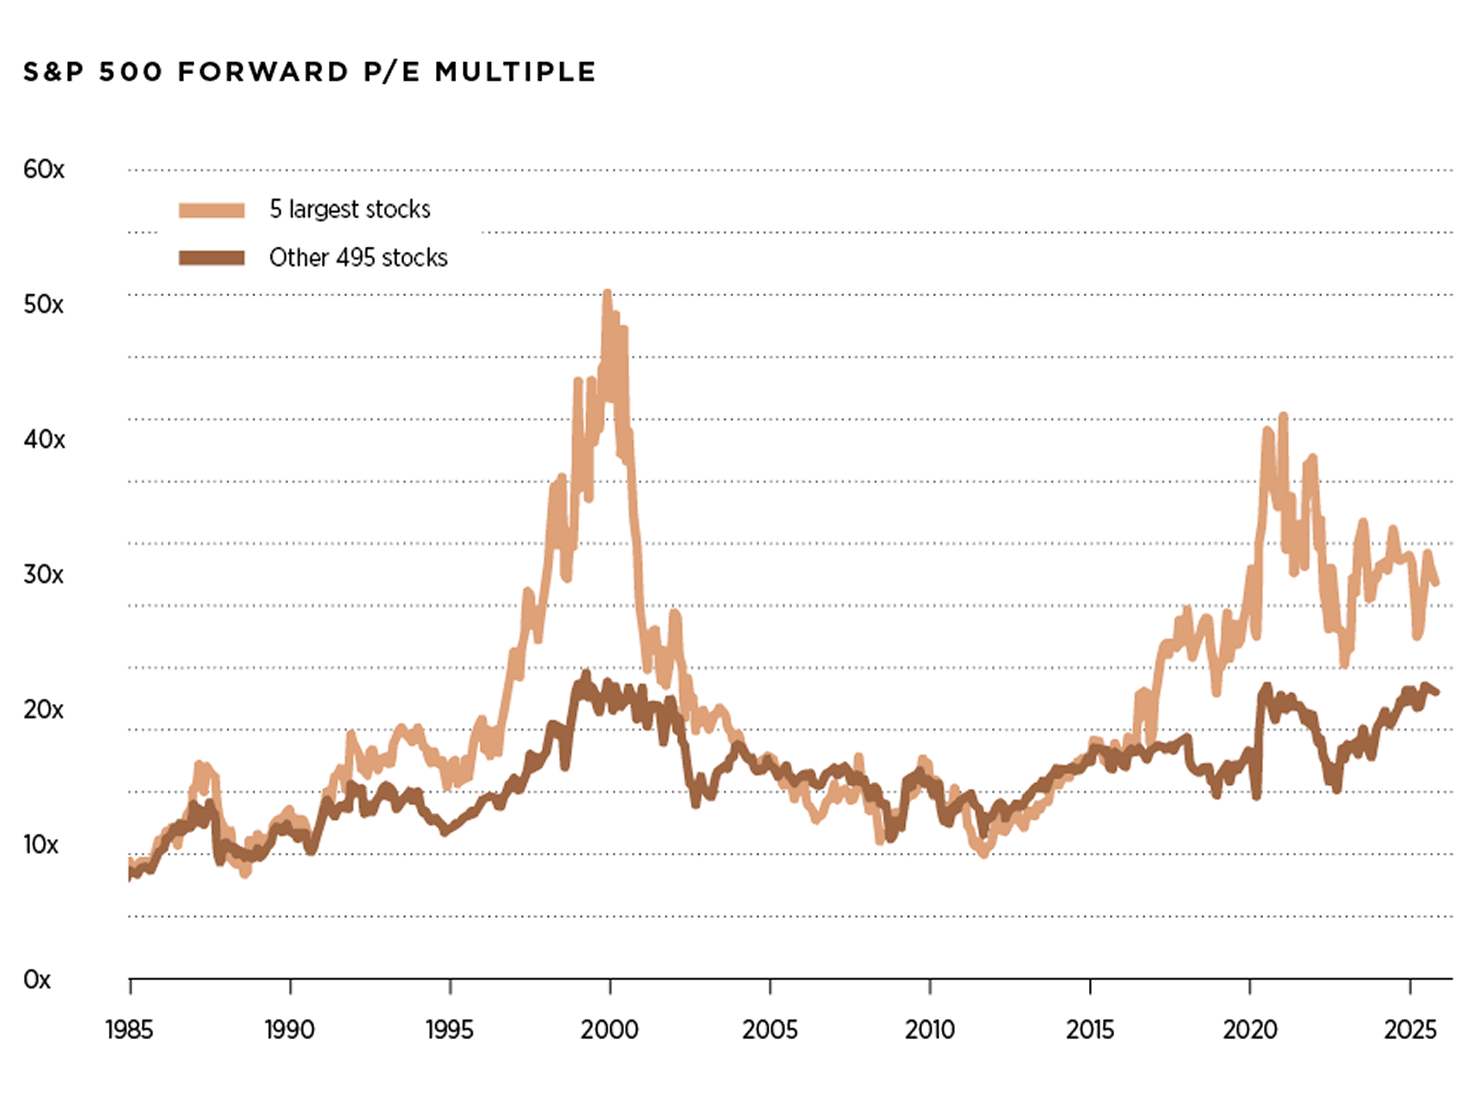
Valuations for today’s largest stocks also remain well below those of the largest stocks at the peaks 2000 and 2021. The five largest stocks in the S&P 500 (Nvidia, Apple, Microsoft, Alphabet and Amazon) currently trade at a P/E multiple of 29x, compared with 40x for the largest stocks at the peak in 2021 and 50x at the peak of the Tech Bubble.
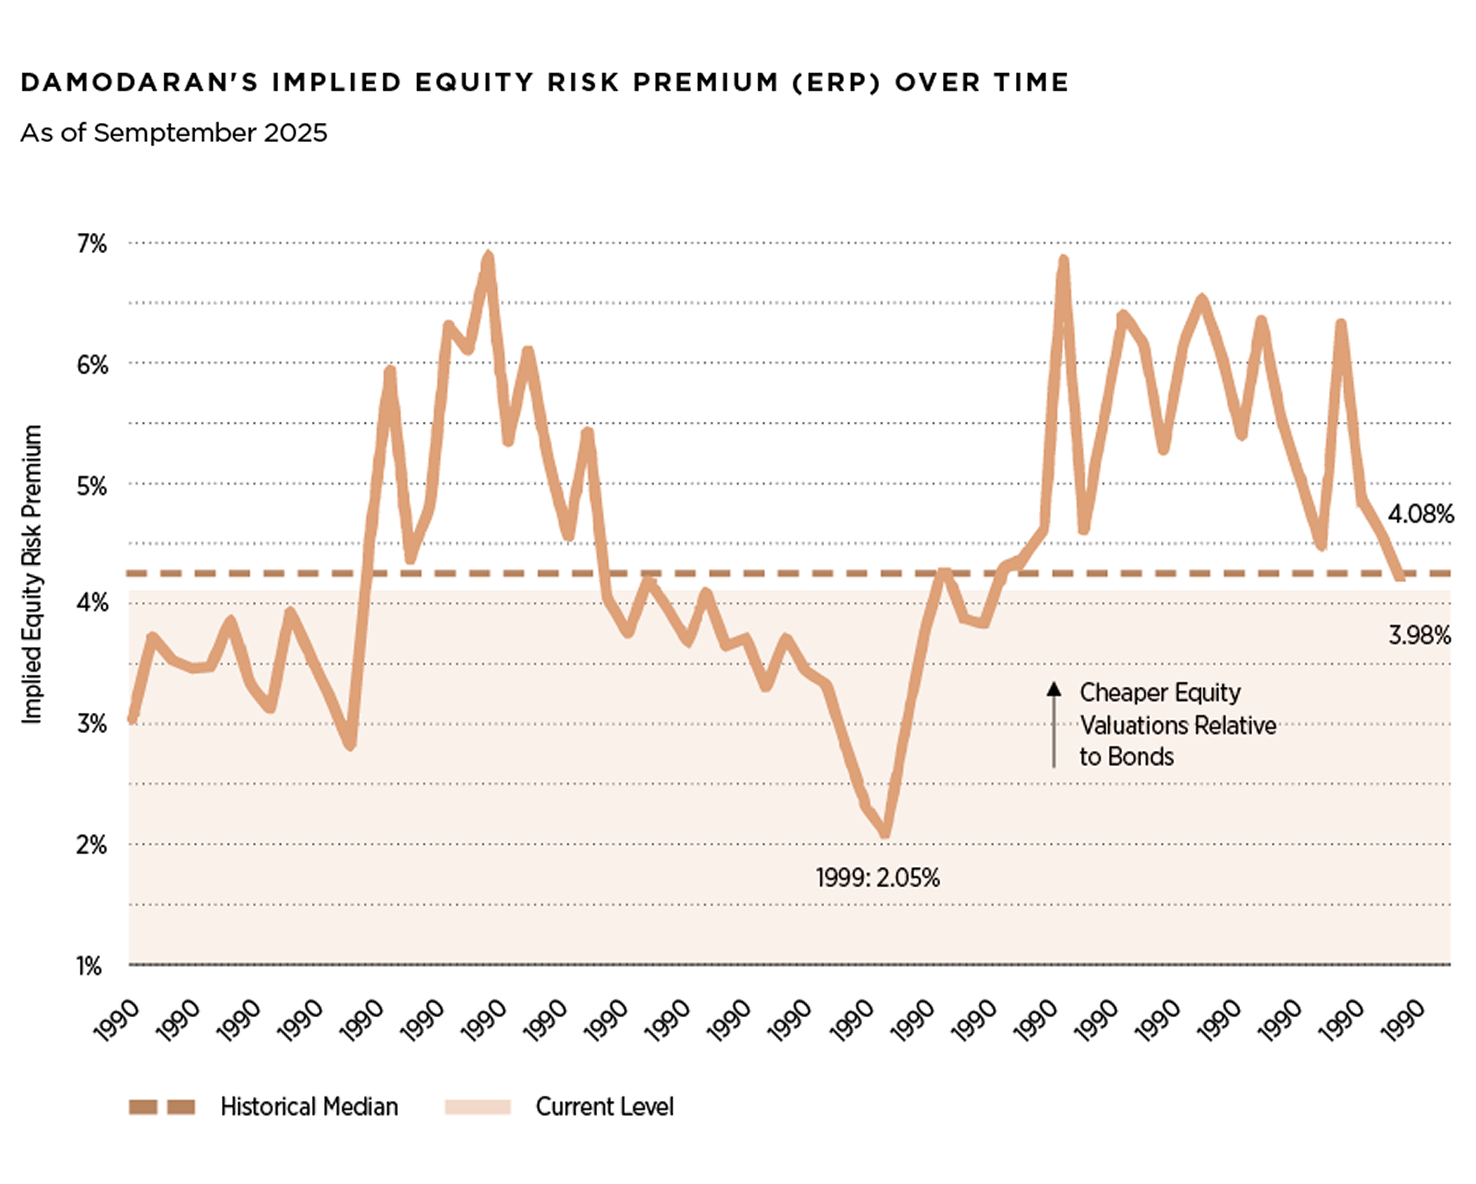
The implied Equity Risk Premium (ERP) represents the additional compensation investors expect for taking on equity risk. Historically, the U.S. implied ERP has generally ranged between 4% and 6%, though it fluctuates with market conditions. For instance, in 1999, the implied ERP fell to around 2% largely due to a combination of extreme investor optimism, strong stock market performance and very low perceived risk. With the current implied ERP near its historical median of around 4%, equity valuations seem to reflect expectations for sustained profitability and shareholder payouts, rather than the unusually low compensation for risk that characterized previous market bubbles.
In 2022, the US real GDP grew 2.5%, 2.9% in 2023, 2.8% in 2024 and Goldman Sachs expects to grow 2.0% in 2025 and 2.0% in 2026. The outlook for global growth will slow from 3.0% in 2022 to 2.8% in 2023, 2.7% in 2024 and expected 2.6% in 2025 and 2.5% in 2026, according to Goldman Sachs, well below the 3.8% historic average of the past two decades. Global inflation is forecast to decline, from 6.5% in 2022 to 4.3% in 2023, 3.2% in 2024 and expected 2.7% in 2025 and 2.7% in 2026. The growth rate for China, the world’s second-largest economy, reached 5.4% in 2023, 5.0% in 2024 and is expected to grow 4.8% in 2025 and 4.2% in 2026. China’s economy is facing growing headwinds because of the ongoing trade war with the US, declines in real estate investment, housing prices, weak consumer sentiment and ongoing demographic deterioration. The Euro Area is expected to slow from 3.4% in 2022 to 0.5% in 2023, in 2024 0.7 yet the growth rate forecast for 2025 is 1.3% and 1.3% in 2026, as a result is likely to avoid a recession according to Goldman Sachs.
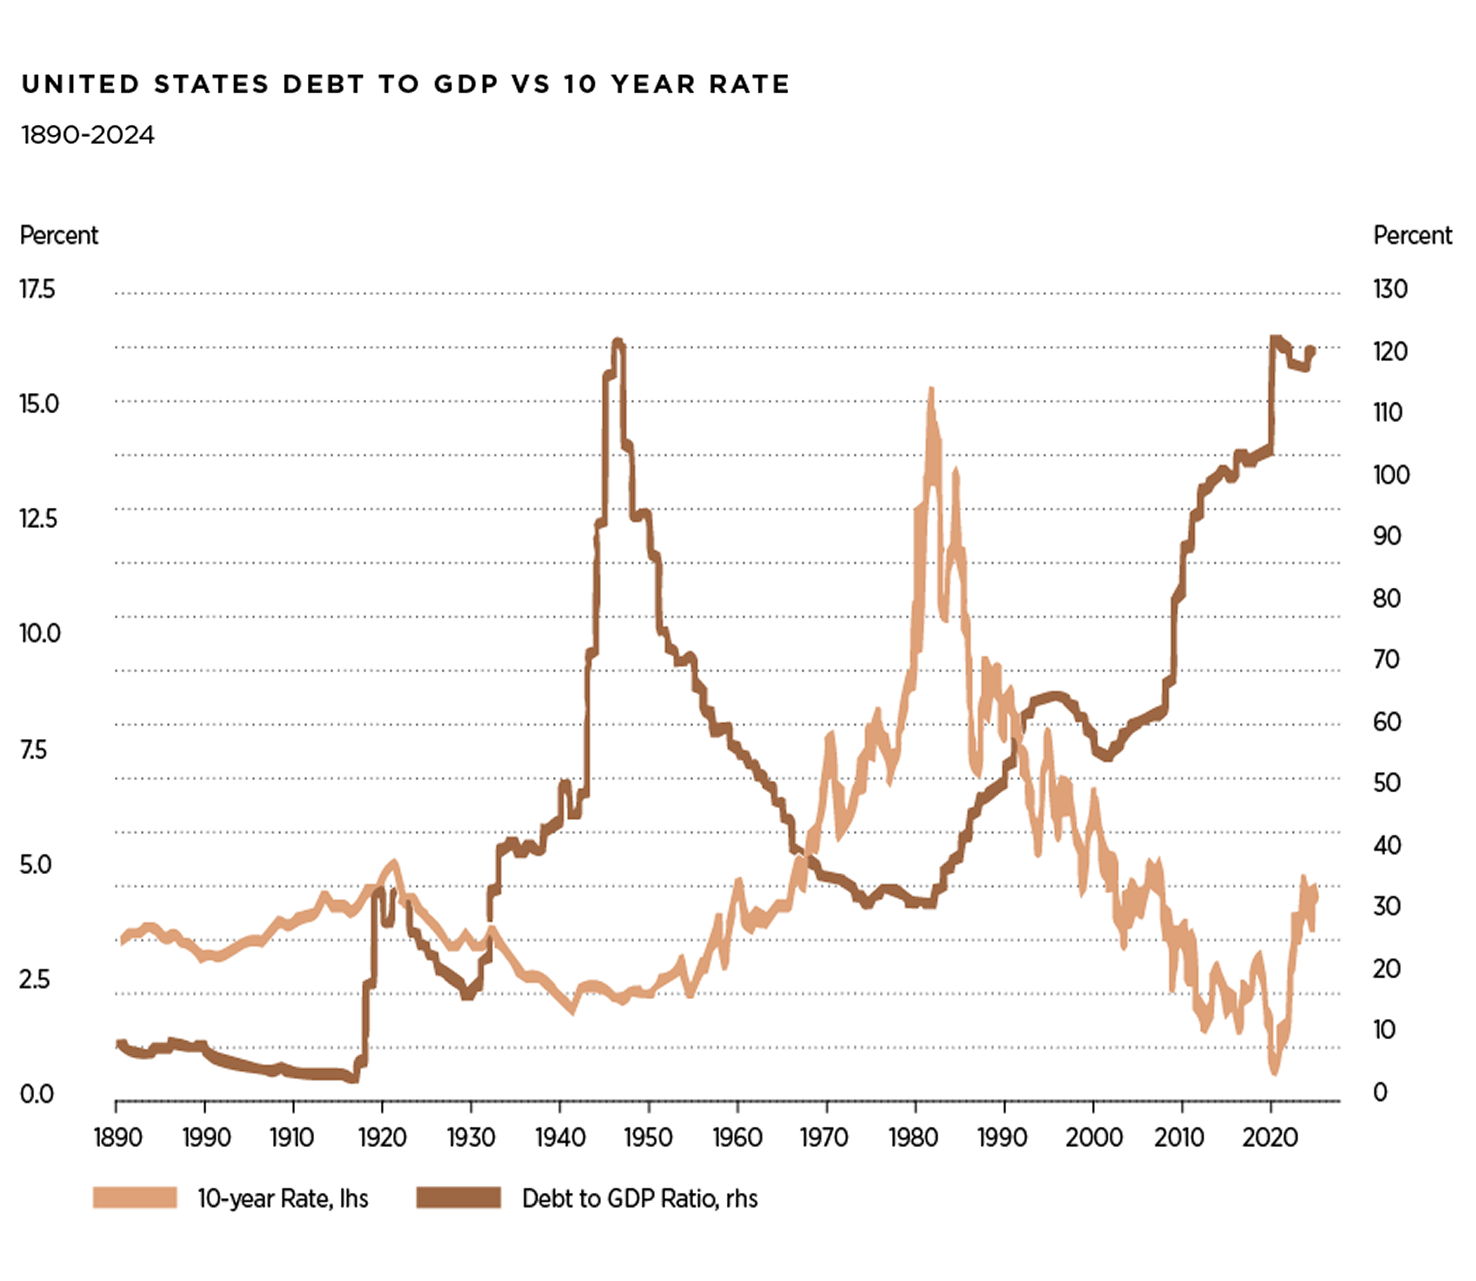
The US Federal government debt reached USD $38 trillion dollars at the end of 2025. The debt-to-GDP ratio has increased from a pre-GFC low of 35% in 2007 to 125% in 2025 and is likely to increase over the next decade unless the US is able to grow its economy, decrease its debt and reduced its fiscal deficit. Otherwise, this debt trajectory is not sustainable and is uncertain where the tipping point might be. The US debt limit crisis in 2011 ended with a compromise that averted default but prompted downgrades by S&P Global Ratings as it stripped the US from its top score and sent the S&P 500 down 17%. In August 2023, Fitch Ratings downgrade the US debt to AA+ from AAA and in November 2023, Moody’s lowered the US sovereign outlook to negative from stable while affirming the rating of Aaa, the highest investment-grade notch. However, on May 16, 2025, Moody’s lowered the US credit score to Aa1 from Aaa joining Fitch Ratings and S&P Global Ratings in grading the world’s biggest economy below the top triple-A position. US policy-making has become less stable, less effective and less predictable as intensifying polarization and dysfunction in the decision-making process is evident among US elected officials, successive administrations and Congress.
The US government runs persistent budget deficits as it spends more than it collects in revenue. According to the Congressional Budget Office (CBO), fiscal deficit is expected to reach USD $1.85 trillion at the end of 2025 around 6.0% of GDP, almost double the USD $984 billon level in 2019 and as high as the peak immediately after 1945. Net interest payments due on federal debt are USD $1.0 trillion per year, around 3.2% of GDP. The One Big Beautiful Bill (OBBB) Act was signed into law by President Donald Trump on July 4, 2025 and is a sweeping reform package aimed to extend and expand tax cuts, spending changes, stimulate economic growth, strengthen border security, promote education reform and streamline regulatory policies. However, according to the CBO, the OBBB Act is expected to increase the budget deficit by approximately $4.1 trillion from fiscal year 2025 to 2034. In addition, the OBBB Act played a significant role in the U.S. government shutdown that began in October 1, 2025. The OBBB Act introduced substantial cuts to federal programs including reductions in Medicaid funding and changes to healthcare subsidies. The longest shutdown on record in the US was in 2018 and lasted 34 days but spared several agencies, including the Department of Defense, which Congress had already funded. Prior government-wide shutdowns have lasted no longer than a week, but it seems likely that this shutdown will last longer.
On August 15th, 2025, President Donald Trump met with President Vladimir Putin at a military base in Anchorage, Alaska. The Alaska summit produced no peace agreement in Ukraine, though it symbolized renewed US-Russia engagement and both sides mentioned a potential follow-up meeting in Budapest, Hungary. However, on October 23, 2025, the Trump administration announced new package of sanctions targeting Russia’s two largest oil companies, in a major policy shift to pressure Moscow to negotiate a peace deal in Ukraine. The European Union joined the U.S. by piling additional pressure on the Kremlin with a fresh round of sanctions targeting Russia’s energy and liquefied natural gas infrastructure, including: Rosneft and Gazprom. The move comes at a time when global supply looks plentiful. Nations inside and outside the OPEC+ producer alliance have been ramping up output amid signs of cooling demand growth. However, India is under pressure to source its oil elsewhere, which is likely to increase demand for non-Russian oil and this will likely lead to reduce the oversupply in the oil market and to higher oil prices.
During 2025, WTI prices fluctuated back and forth in the range of USD $56-72 per barrel. However, oil soared after the US blacklisted Russian oil giants Rosneft and Lukoil. WTI jumped as much as 6.2% to trade above USD $61 per barrel, Brent at USD $66 per barrel and natural gas at USD $3.3 per million of BTU. According to Goldman Sachs estimates, WTI prices are expected to range USD $64-60 in the remainder of 2025 and to range USD $56-52 per barrel in 2026. OPEC formation occurred in 1960 by five founding members: Iran, Iraq, Kuwait, Saudi Arabia and Venezuela at a time of transition in the international economic and political landscape. While oil markets are not currently pricing a worst-case scenario of the Middle East crisis as it did in the 1970s (Arab-Israeli war/Oil embargo), 1980s (Iran-Iraq war) and 1990s (invasion of Kuwait), the tail risk of a very large oil price spikes remains as a result of rising geopolitical, oil supply disruptions and the escalation of two ongoing wars.

The Basel Committee on Banking Supervision was set up in 1974 by central banking governors of the Group of Ten countries in order to maintain oversight of global banking standards and higher levels of capital adequacy. The new Basel III Accords, implemented across various regions since 2021, treat gold held in vaults as a zero-risk asset and classifies it as a Tier 1 Asset, a status previously reserved for cash. These rules mean banks must hold more high-quality assets like gold to safeguard against financial crisis. This regulatory shift is expected to influence gold demand significantly, driving prices up and reaffirming gold’s role a secure and stable investment. Central bank gold holdings reached their lowest point in 2009 and have since increased, following the Global Financial Crisis (GFC), the partial breakdown of the post-war world order, rising government debt, growing distrust in institutions and mounting aversion to fiat currencies.
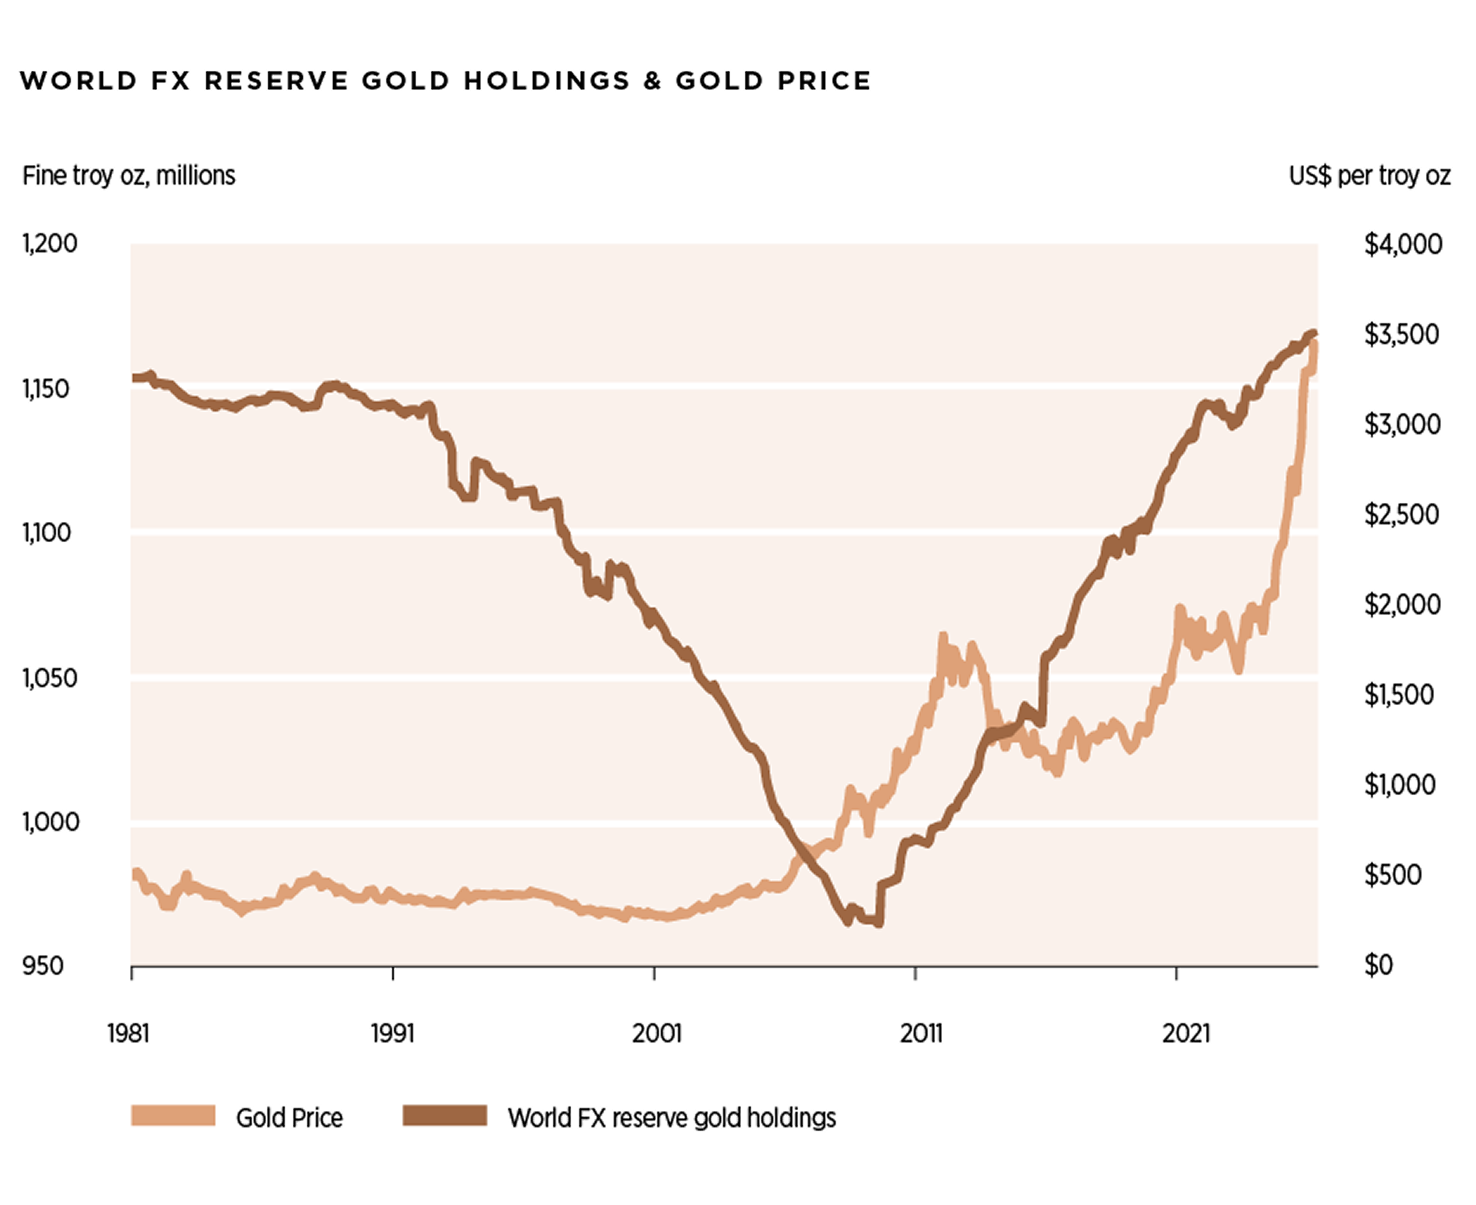
Further, on February 2022, the United States, the European Union, the United Kingdom, Canada and Japan jointly announced the freezing of Russian’s foreign exchange reserves held abroad. This action effectively immobilized around $300 billion dollars of Russian assets that were kept in foreign accounts. This action highlighted the vulnerability of the U.S. dollar and other fiat currency holdings to external sanctions, enhancing the appeal of gold as a safe-haven asset. Since then, central banks, particularly those of China, India, Turkey, Poland and Russia have significantly increased their gold reserves to diversify their holdings and reduce exposure to the dollar. Weaponization of the dollar, through sanctions against Russia, China’s efforts to lessen its dollar dependence, and global economic fragmentation is likely to cut demand for safe U.S. assets. Year-to date, gold’s performance has been soaring, rising more than 61%.
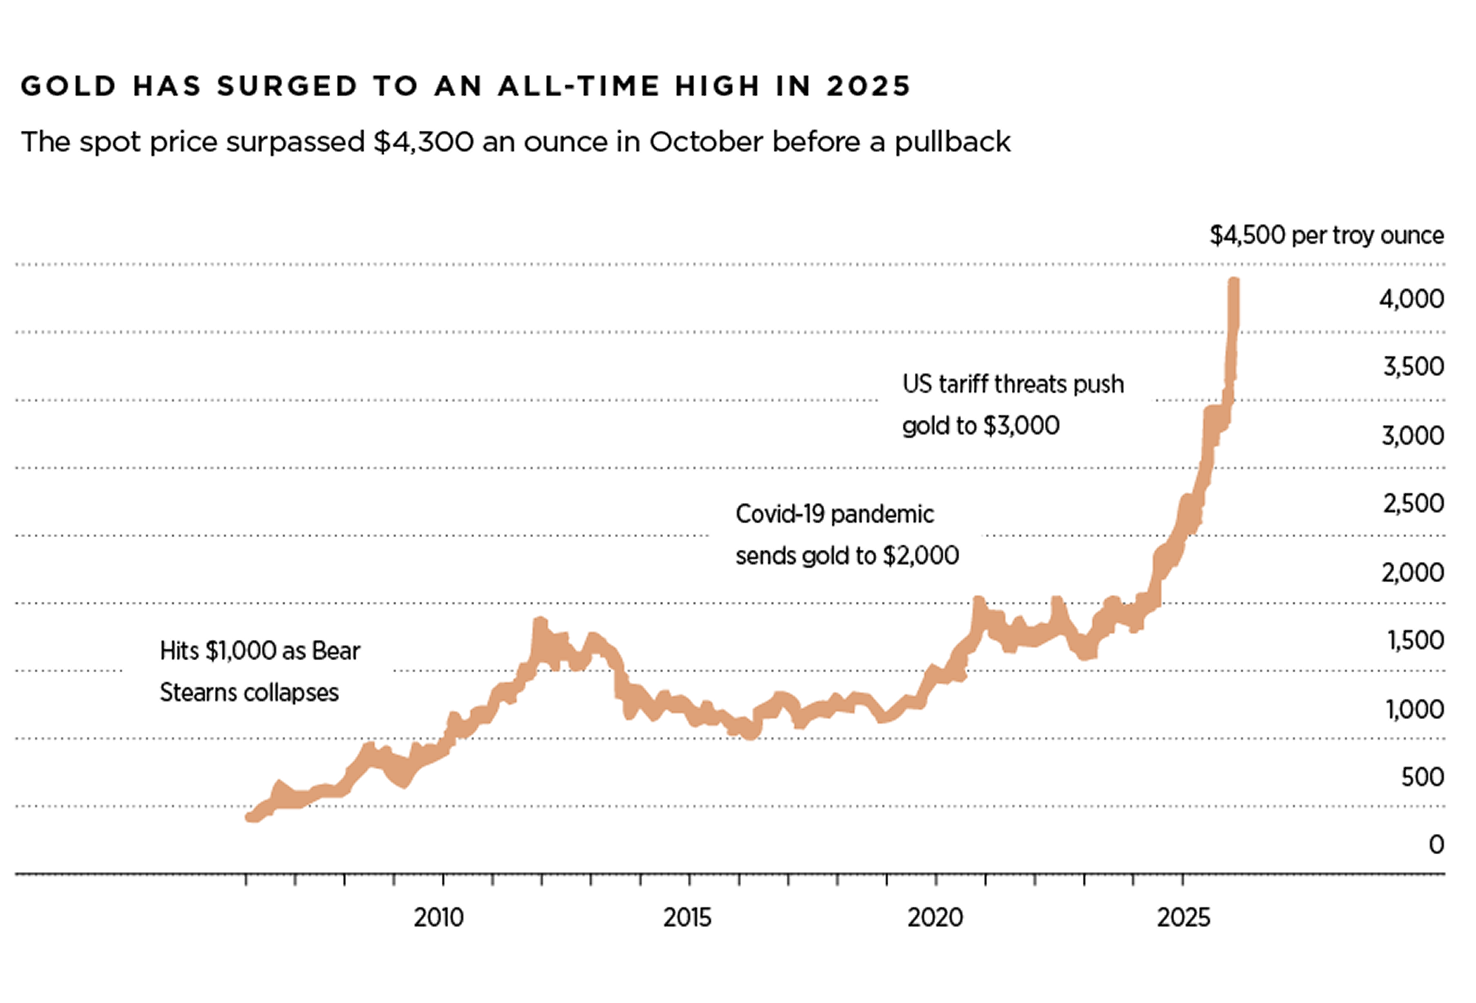
On October 20, 2025, gold reached a new all-time high of USD $4,359 per ounce and fell by 5.6% the next following days. A confluence of factors dragged down the precious metal including positive trade talks between China and US, a stronger dollar, overstretched technicals, and the end of a seasonal buying spree in India.
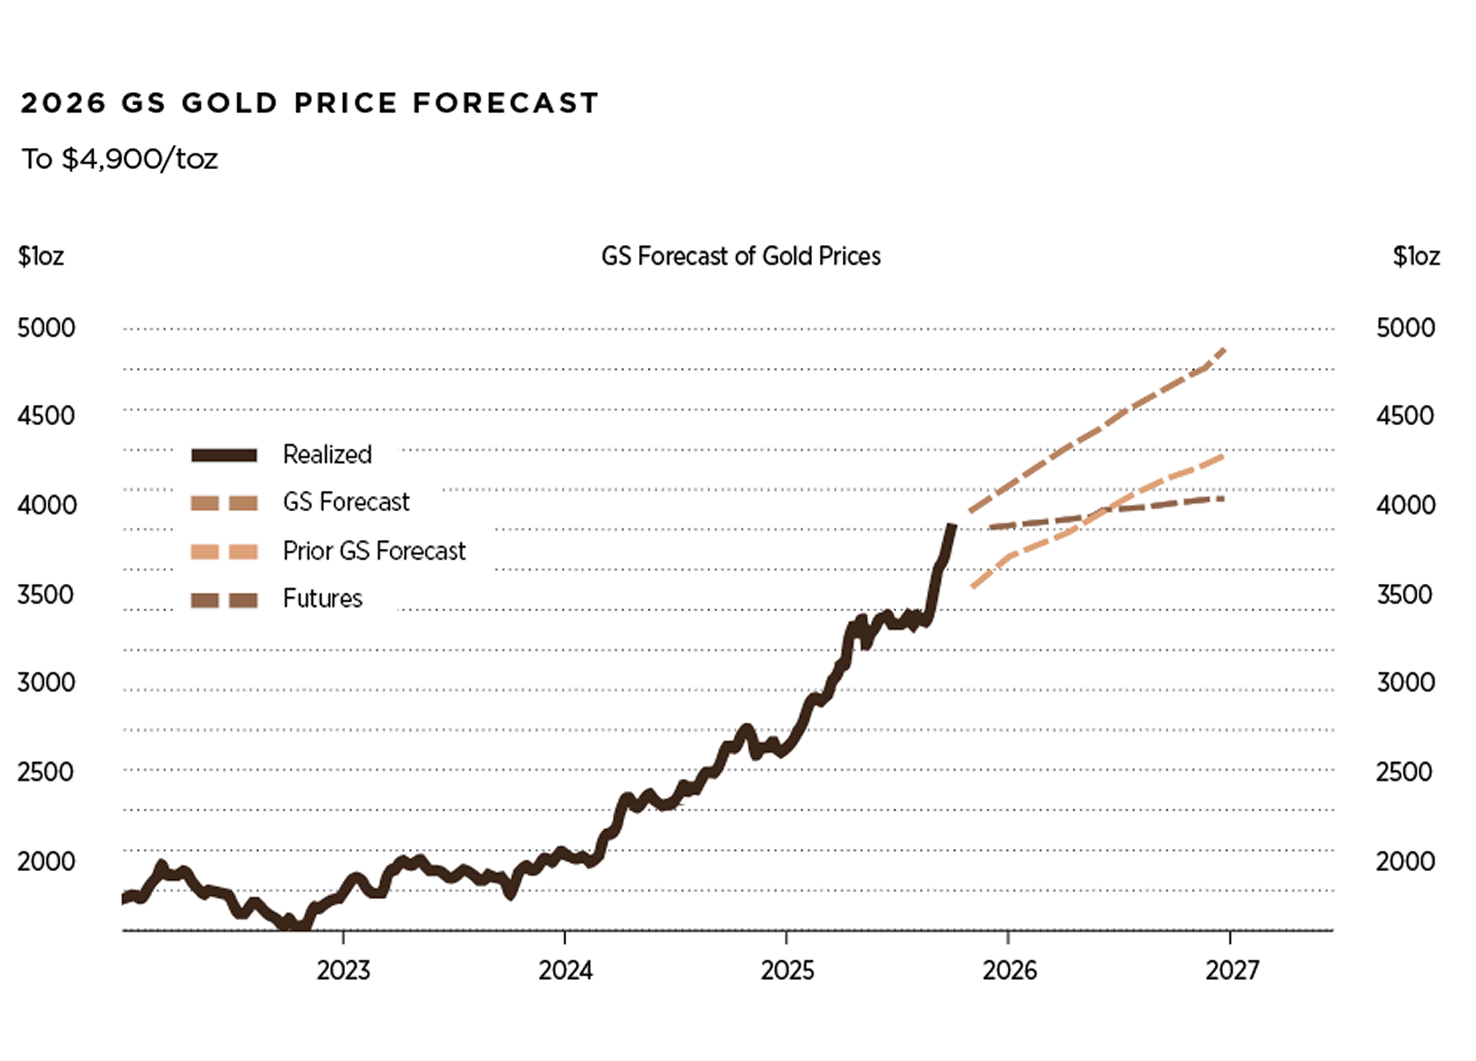
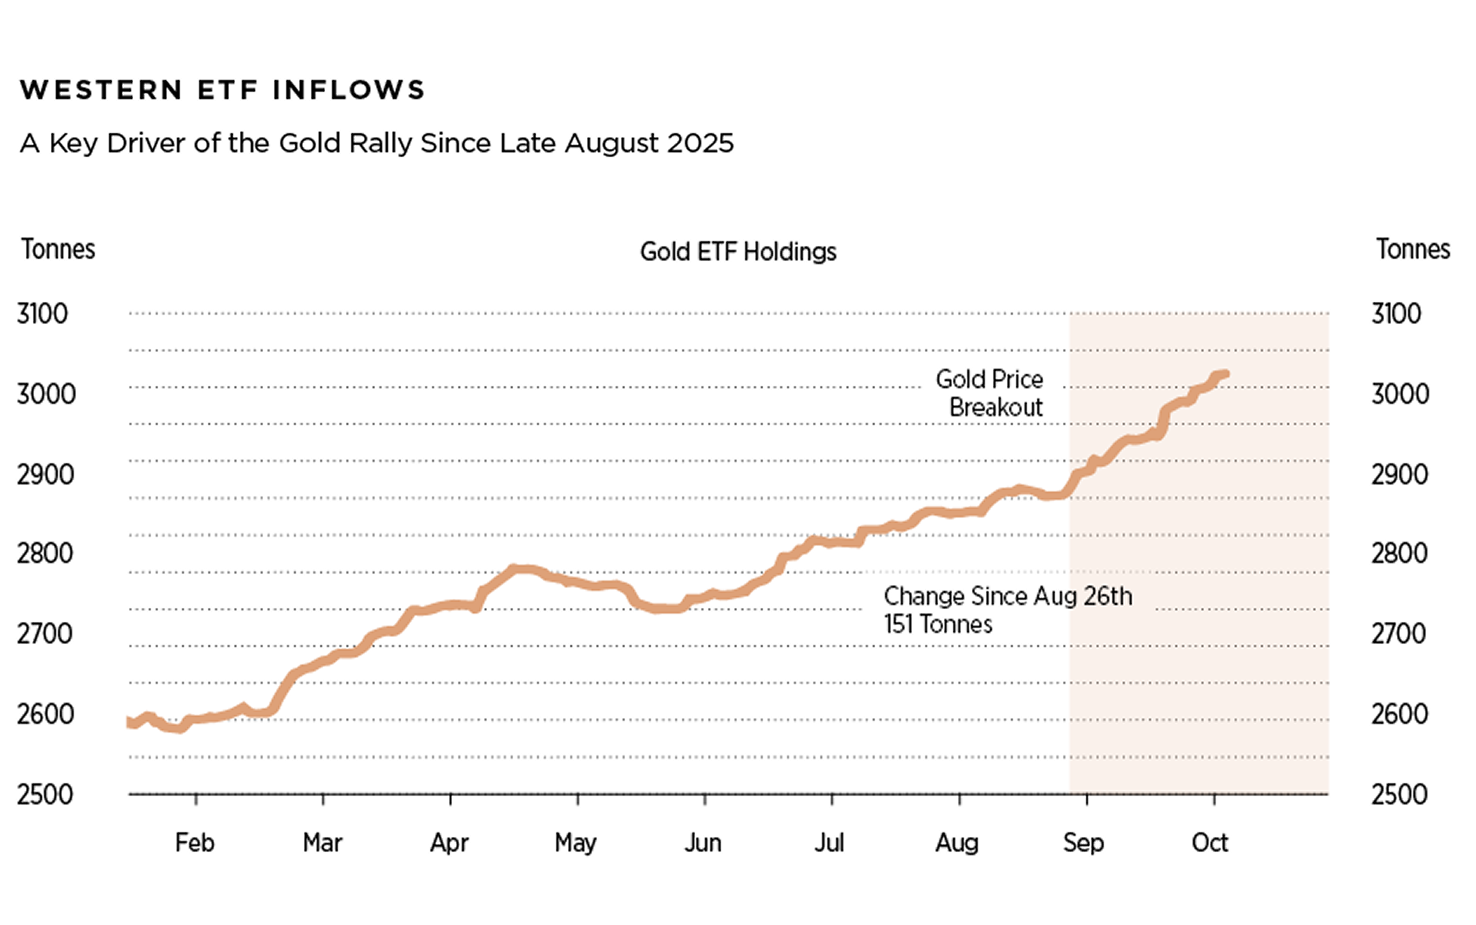
According to Goldman Sachs the year-end 2026 gold forecast is USD $4,900 per ounce, supported by stronger-than-expected central bank demand, persistent Western ETF inflows, U.S. dollar debasement and geopolitical uncertainty.
Ever since the GFC and even more pertinent in the face of the Covid-19 crisis, governments and central banks have launched vast stimulus and rescue programs to bailout financial institutions and the economy. In 2009 someone identified as Satoshi Nakamoto successfully launched Bitcoin, a peer-to-peer payment network that operates without intermediaries, consensus mechanisms, smart contract capability and no need for bailouts. The Bitcoin protocol permanently caps the total supply of bitcoin (BTC) at 21 million coins, and has never been hacked. As a result of its scarcity and security, Bitcoin is often referred to as “digital gold”. Since the launch of Bitcoin, its underlying blockchain technology has inspired an entire new ecosystem of platforms and protocols with a wide range of applications.
On November 8, 2021, Bitcoin reached a record high of USD $67,000 and the global cryptocurrency market capitalization peaked at around USD $3 trillion. However, the bubble burst in early 2022, triggered by the collapse of the then third largest stablecoin TerraUSD. In November 2022, the bankruptcy of FTX, one of the world’s largest crypto exchange platforms sent shockwaves through the ecosystem. However, the FTX blowup has not destroyed all faith in the industry, in particular Bitcoin. On October 6, 2025, Bitcoin reached a new all-time high of USD $125,261 and year-to-date Bitcoin has increase about 17% and the global cryptocurrency market capitalization today is around USD $3.8 trillion. The approval of spot Bitcoin ETFs on January 2024 represented a resounding institutional validation as an asset class. In addition, on March 7, 2025, US President Donald Trump signed an executive order and directed the US Treasury to establish a “Strategic Bitcoin Reserve” and a “Digital Asset Stockpile” that can serve as a secure account for orderly and strategic management of tokens already owned by the government without increasing the federal budget or burdening taxpayers. The GENIUS Act was signed into law on July 18, 2025 by President Trump. The legislation established a comprehensive federal regulatory framework for stablecoins fully backed by U.S. dollars or low-risk assets including US Treasuries. The Act aims to reinforce the U.S. dollar’s position as the world’s leading reserve currency by encouraging the use of stablecoins tied to U.S assets. According to Treasury Secretary Scott Bessent, “stablecoins represent a revolution in digital finance”. “The dollar now has an internet-native payment rail that is fast, frictionless, and free of middlemen. “The signing of the GENIUS Act marks a seminal moment for digital assets and dollar supremacy”.
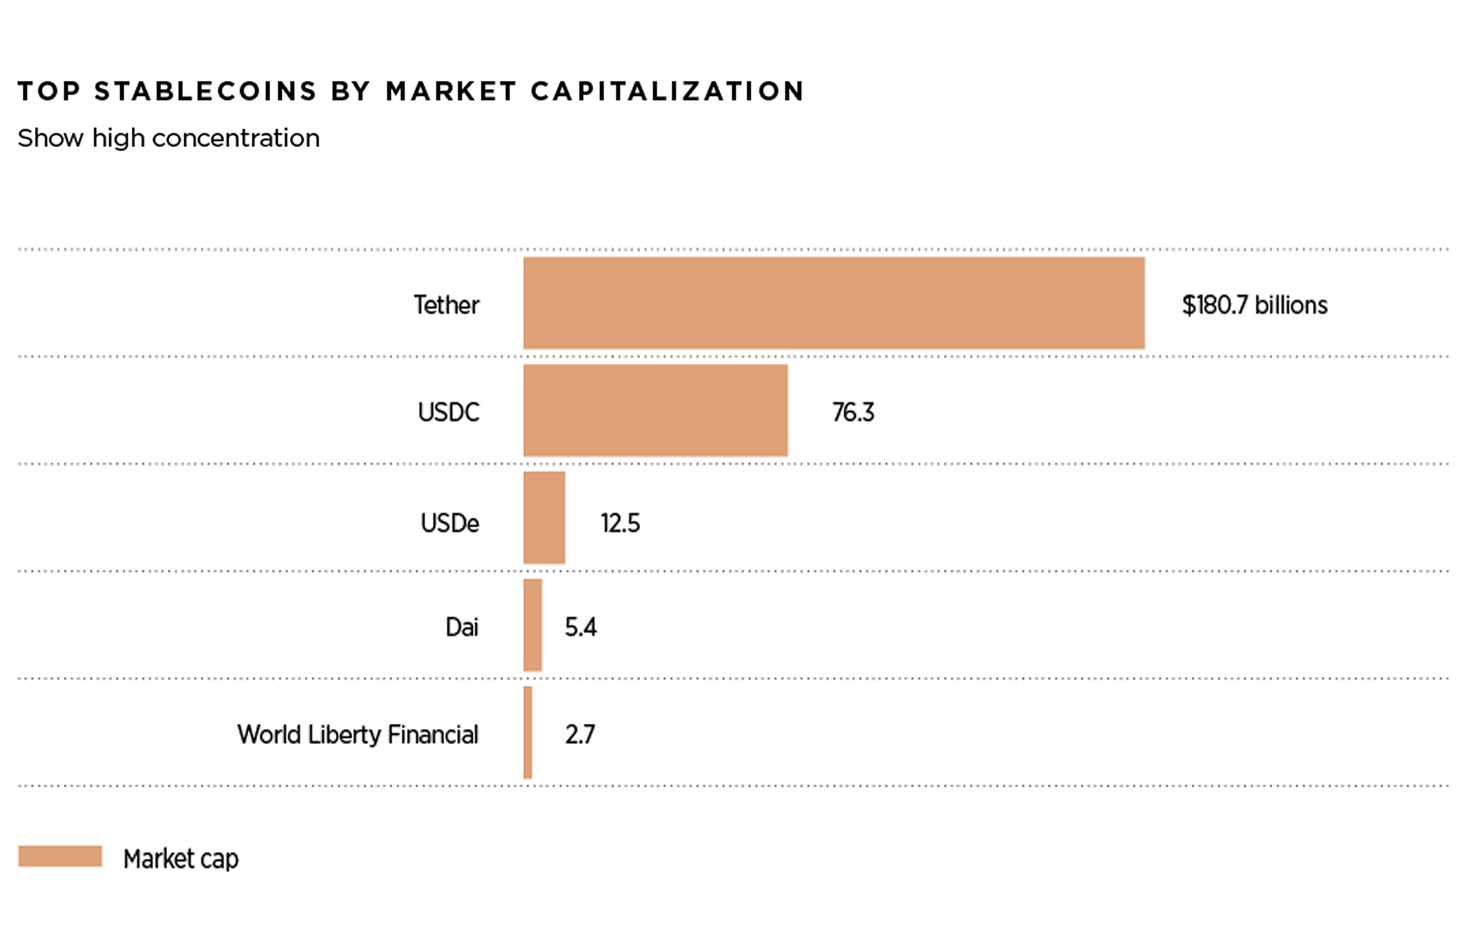
The global stablecoin market capitalization has surpassed $300 billion and is largely dominated by USD-denominated digital currencies, primarily issued by private companies. Stablecoins have the potential to enable individuals and businesses to bypass traditional banks for deposits, payments, and remittance services, posing a significant challenge to legacy banking systems. Some European Central Bank members are concerned that the increasing use of USD stablecoins could lead to euro deposits migrating to the United States. As a result, EU policymakers view the launch of a central bank digital currency (CBDC) on a private blockchain as a critical step toward safeguarding the euro’s international role. Similarly, China is accelerating its digital e-yuan initiatives to maintain control over its domestic payment system and strengthen its influence in the global digital currency landscape.
The Bretton Woods Agreement of 1944 which pegged other currencies to the dollar, established the US dollar as the dominant currency and the foundation of the international monetary system. Although the gold standard was abandoned in 1971, for the past 80 years, the US dollar has remained the most widely held currency for central banks reserves. To date, over 80% of global trade is conducted in US dollars, about 70% of foreign currency debt is denominated in US dollars and it remains the currency of choice for oil, commodities, exchange transactions and international loans. In times of uncertainty and stress, the US dollar is proving to be the world’s safe haven asset and king. However, the second Trump administration’s policy of slapping punishing tariffs on US trading partners is eroding investor, consumer and business confidence in the US dollar as the cornerstone of the global financial system. In addition, is important to acknowledge that a new cycle of innovation is shaping the future of finance particularly in the aftermath of the GFC. Traditional financial institutions are increasingly vulnerable to the rise of newcomers in the financial technology (FinTech), digital assets and decentralized finance (DeFi).
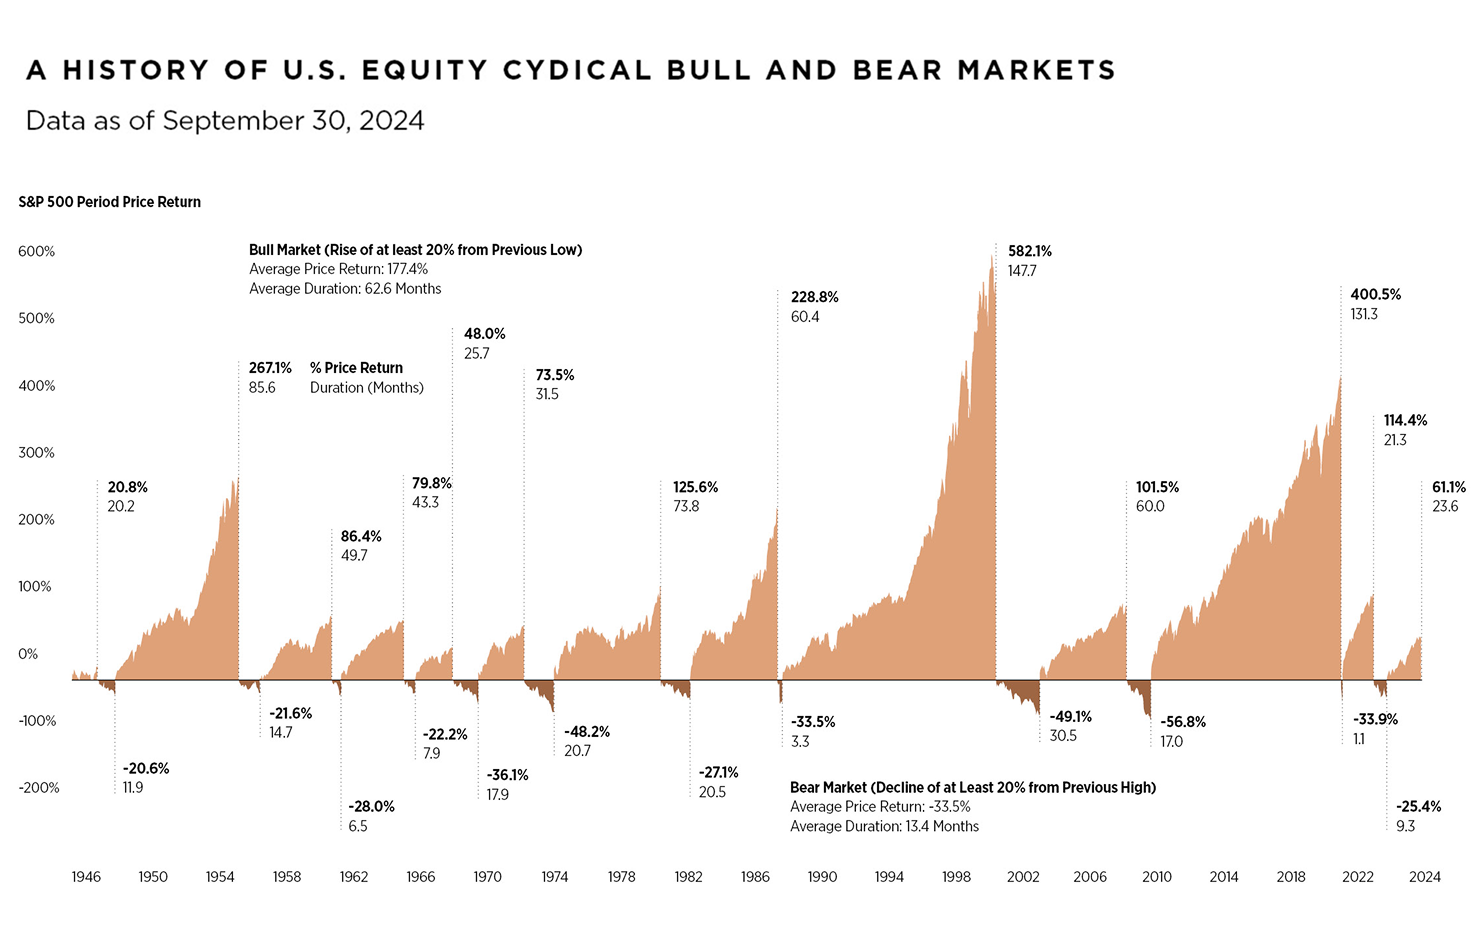
Capital markets are cyclical in nature. Since the late 1920s, the S&P 500 has experienced 29 bear markets and on average bear markets in the US last 26 months. Fortunately, as proven by history, for every bear market, a bull market follows. The start of the bull market almost always begins during recessions when the economy contracts and bad news abound. Since 1946, bull markets last on average 63 months and bear markets 13 months.
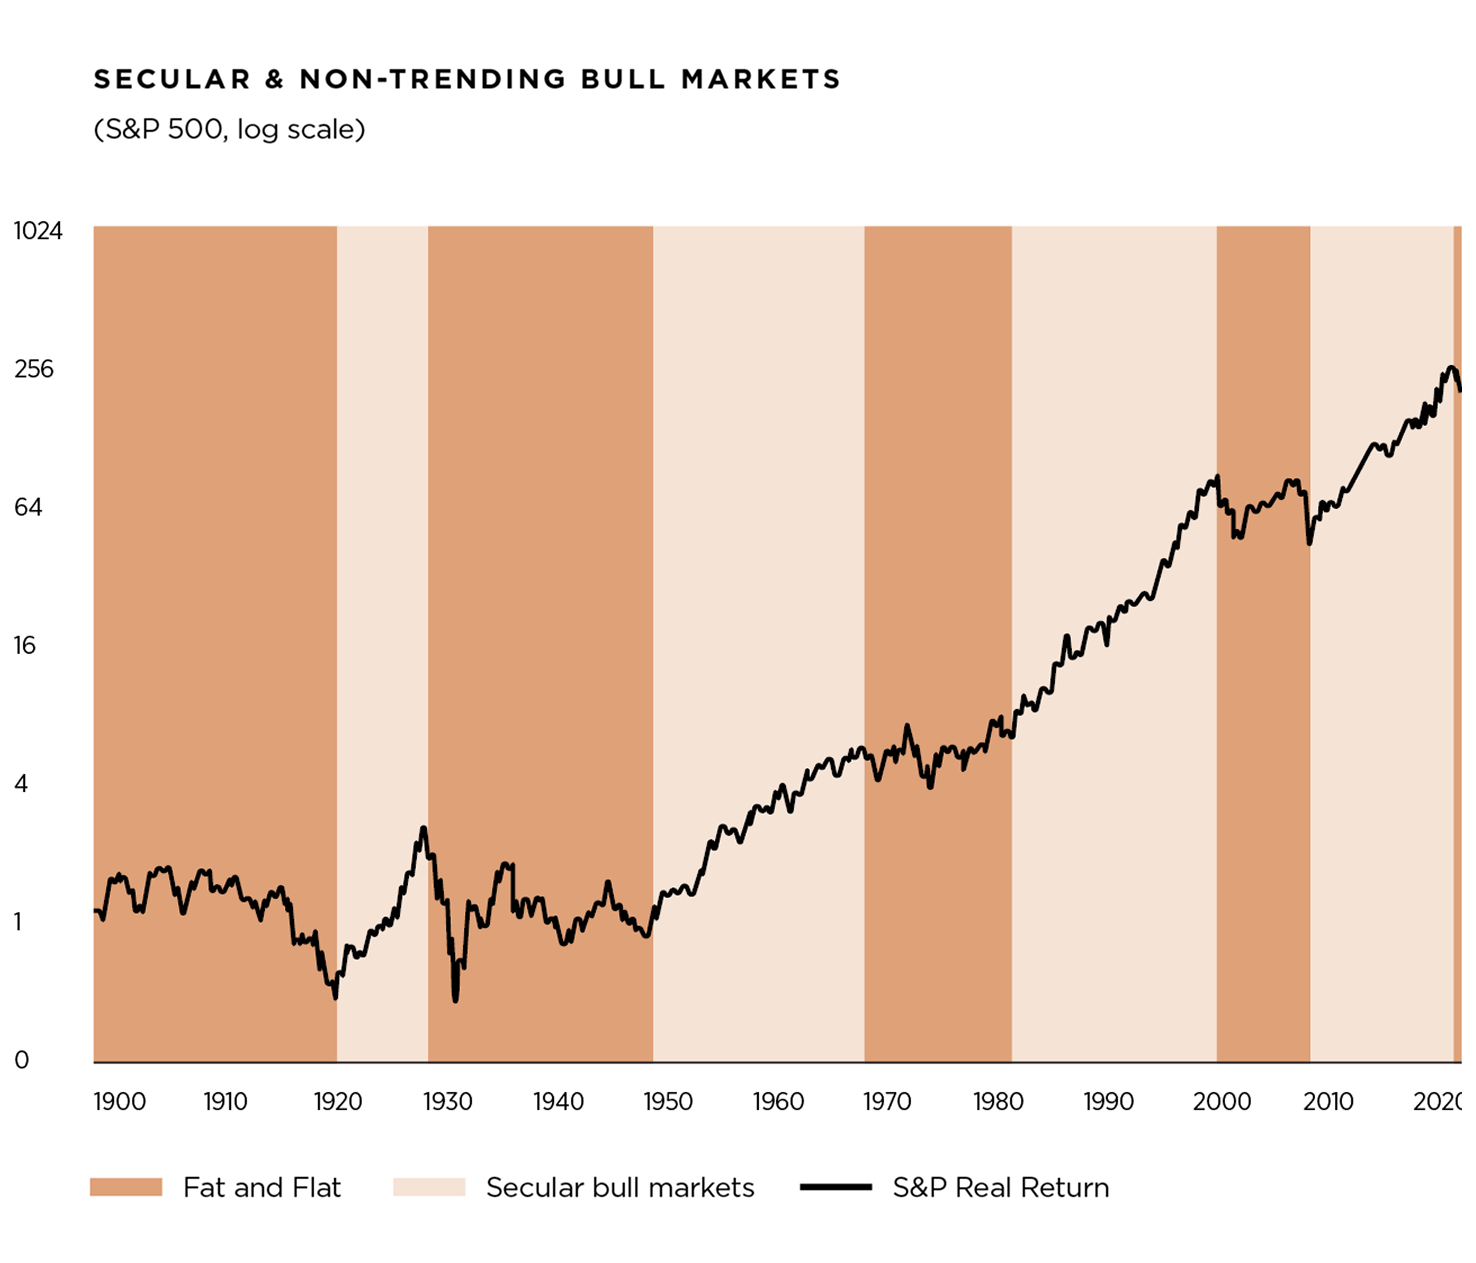
While recessions are fairly common, no one knows when the next recession might occur. The US equity market’s domination has accelerated dramatically in recent years particularly since the GFC and have had one of the longest and strongest periods in history of outperformance relative to non-US equities, bonds and cash.
To maintain its exceptional status and hegemony, the US must continue to serve as a beacon of democracy, education, rule of law, checks & balances, economic stability and a leader in the international order. We believe the factors that underpin US preeminence and exceptionalism will continue to persist into the foreseeable future.

Pedro David Martínez
CEO, Regius Magazine.
regiusmagazine.com

Homero Elizondo
Head of Research, Regius Magazine.
regiusmagazine.com